Estimated Value: $394,000 - $424,000
3
Beds
2
Baths
2,084
Sq Ft
$193/Sq Ft
Est. Value
About This Home
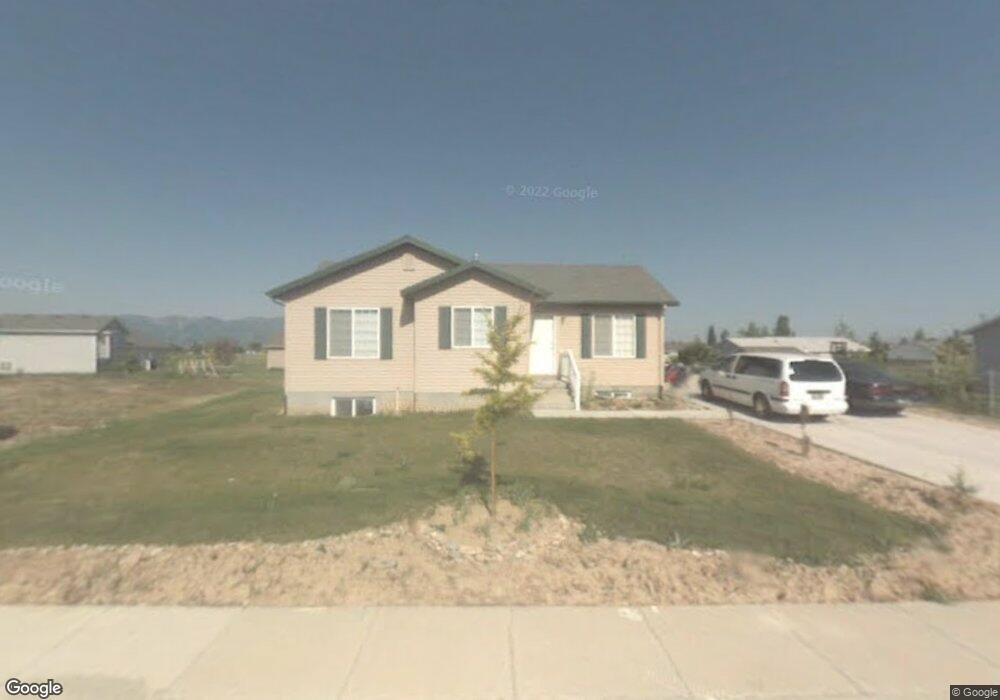
This home is located at 116 S 1070 E, Hyrum, UT 84319 and is currently estimated at $402,529, approximately $193 per square foot. 116 S 1070 E is a home located in Cache County with nearby schools including Canyon School, South Cache Middle School, and Mountain Crest High School.
Ownership History
Date
Name
Owned For
Owner Type
Purchase Details
Closed on
Aug 13, 2018
Sold by
Bunce Randy S and Bunce Rowena R
Bought by
Bunce Randy S and Bunce Rowena R
Current Estimated Value
Home Financials for this Owner
Home Financials are based on the most recent Mortgage that was taken out on this home.
Original Mortgage
$163,000
Outstanding Balance
$133,152
Interest Rate
4.5%
Mortgage Type
New Conventional
Estimated Equity
$269,377
Purchase Details
Closed on
Jun 9, 2017
Sold by
Bunce Randy Scott and Bunce Rowena Rawlins
Bought by
Bunce Randy S and Bunce Rowena R
Home Financials for this Owner
Home Financials are based on the most recent Mortgage that was taken out on this home.
Original Mortgage
$118,000
Interest Rate
4.05%
Mortgage Type
New Conventional
Purchase Details
Closed on
Mar 17, 2006
Sold by
Kartchner Homes
Bought by
Bunce Randy Scott and Bunce Rowena Rawlins
Home Financials for this Owner
Home Financials are based on the most recent Mortgage that was taken out on this home.
Original Mortgage
$127,943
Interest Rate
6.19%
Mortgage Type
New Conventional
Purchase Details
Closed on
Aug 9, 2005
Sold by
Blanchard Donald E and Blanchard Emily N
Bought by
Karthcner Homes
Purchase Details
Closed on
May 11, 2005
Sold by
Southridge Acres Llc
Bought by
Blanchard Donald E and Blanchard Emily N
Home Financials for this Owner
Home Financials are based on the most recent Mortgage that was taken out on this home.
Original Mortgage
$104,000
Interest Rate
5.87%
Mortgage Type
Purchase Money Mortgage
Create a Home Valuation Report for This Property
The Home Valuation Report is an in-depth analysis detailing your home's value as well as a comparison with similar homes in the area
Home Values in the Area
Average Home Value in this Area
Purchase History
| Date | Buyer | Sale Price | Title Company |
|---|---|---|---|
| Bunce Randy S | -- | Vantage Title Insurance Agen | |
| Bunce Randy S | -- | Pinnacle Title | |
| Bunce Randy Scott | -- | Cache Title Company | |
| Karthcner Homes | -- | Northern Title Company | |
| Blanchard Donald E | -- | Northern Title Company |
Source: Public Records
Mortgage History
| Date | Status | Borrower | Loan Amount |
|---|---|---|---|
| Open | Bunce Randy S | $163,000 | |
| Closed | Bunce Randy S | $118,000 | |
| Previous Owner | Bunce Randy Scott | $127,943 | |
| Previous Owner | Blanchard Donald E | $104,000 |
Source: Public Records
Tax History
| Year | Tax Paid | Tax Assessment Tax Assessment Total Assessment is a certain percentage of the fair market value that is determined by local assessors to be the total taxable value of land and additions on the property. | Land | Improvement |
|---|---|---|---|---|
| 2025 | $1,482 | $212,745 | $0 | $0 |
| 2024 | $1,579 | $211,690 | $0 | $0 |
| 2023 | $1,628 | $208,740 | $0 | $0 |
| 2022 | $1,699 | $208,740 | $0 | $0 |
| 2021 | $1,673 | $316,630 | $65,050 | $251,580 |
| 2020 | $1,353 | $240,310 | $65,050 | $175,260 |
| 2019 | $1,288 | $215,260 | $40,000 | $175,260 |
| 2018 | $1,191 | $192,400 | $40,000 | $152,400 |
| 2017 | $1,087 | $91,080 | $0 | $0 |
| 2016 | $1,111 | $91,080 | $0 | $0 |
| 2015 | $926 | $75,715 | $0 | $0 |
| 2014 | $906 | $75,715 | $0 | $0 |
| 2013 | -- | $75,715 | $0 | $0 |
Source: Public Records
Map
Nearby Homes
Your Personal Tour Guide
Ask me questions while you tour the home.