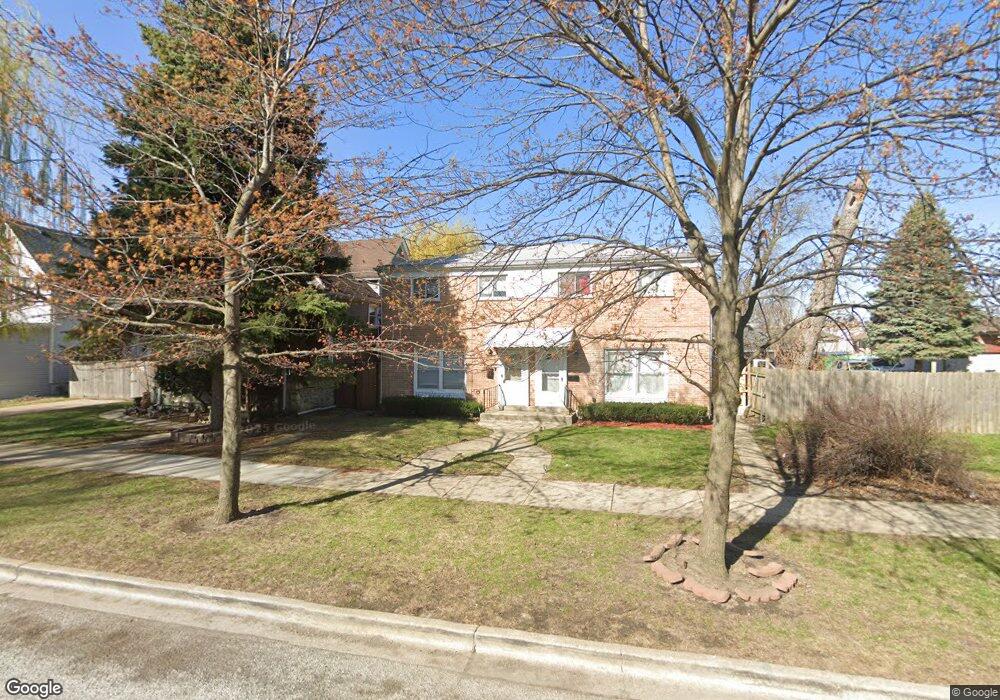
116 S 14th Ave Unit 116 Maywood, IL 60153
Heritage District NeighborhoodEstimated Value: $182,000 - $218,000
3
Beds
1
Bath
1,104
Sq Ft
$179/Sq Ft
Est. Value
About This Home
This home is located at 116 S 14th Ave Unit 116, Maywood, IL 60153 and is currently estimated at $198,000, approximately $179 per square foot. 116 S 14th Ave Unit 116 is a home located in Cook County with nearby schools including Emerson Elementary School, Irving Middle School, and Proviso East High School.
Ownership History
Date
Name
Owned For
Owner Type
Purchase Details
Closed on
Aug 22, 2024
Sold by
Panek Mark
Bought by
Juarez Gonzalo Flores
Current Estimated Value
Home Financials for this Owner
Home Financials are based on the most recent Mortgage that was taken out on this home.
Original Mortgage
$162,072
Outstanding Balance
$161,487
Interest Rate
8.25%
Mortgage Type
New Conventional
Estimated Equity
$36,513
Purchase Details
Closed on
Aug 3, 2009
Sold by
Deutsche Bank National Trust Company
Bought by
Panek Mark
Purchase Details
Closed on
Mar 26, 2009
Sold by
Hayde
Bought by
Deutsche Bank National Trust Company
Purchase Details
Closed on
Nov 12, 2003
Sold by
Maney Antonio and Maney Annie S
Bought by
Hayde Ned
Home Financials for this Owner
Home Financials are based on the most recent Mortgage that was taken out on this home.
Original Mortgage
$86,000
Interest Rate
9.34%
Mortgage Type
Unknown
Purchase Details
Closed on
Jan 14, 1999
Sold by
Maney Antonio and Maney Annie S
Bought by
Maney Antonio and Maney Annie S
Create a Home Valuation Report for This Property
The Home Valuation Report is an in-depth analysis detailing your home's value as well as a comparison with similar homes in the area
Home Values in the Area
Average Home Value in this Area
Purchase History
| Date | Buyer | Sale Price | Title Company |
|---|---|---|---|
| Juarez Gonzalo Flores | $180,500 | None Listed On Document | |
| Panek Mark | $15,000 | Ticor Title Insurance Co | |
| Deutsche Bank National Trust Company | -- | Ticor | |
| Hayde Ned | $86,000 | First American Title | |
| Maney Antonio | -- | -- |
Source: Public Records
Mortgage History
| Date | Status | Borrower | Loan Amount |
|---|---|---|---|
| Open | Juarez Gonzalo Flores | $162,072 | |
| Previous Owner | Hayde Ned | $86,000 |
Source: Public Records
Tax History Compared to Growth
Tax History
| Year | Tax Paid | Tax Assessment Tax Assessment Total Assessment is a certain percentage of the fair market value that is determined by local assessors to be the total taxable value of land and additions on the property. | Land | Improvement |
|---|---|---|---|---|
| 2024 | $7,012 | $16,274 | $1,801 | $14,473 |
| 2023 | $4,344 | $16,274 | $1,801 | $14,473 |
| 2022 | $4,344 | $7,717 | $1,556 | $6,161 |
| 2021 | $4,739 | $8,383 | $1,555 | $6,828 |
| 2020 | $4,620 | $8,383 | $1,555 | $6,828 |
| 2019 | $5,288 | $8,370 | $1,391 | $6,979 |
| 2018 | $5,145 | $8,370 | $1,391 | $6,979 |
| 2017 | $4,972 | $8,370 | $1,391 | $6,979 |
| 2016 | $4,817 | $7,757 | $1,228 | $6,529 |
| 2015 | $4,490 | $7,757 | $1,228 | $6,529 |
| 2014 | $4,106 | $7,757 | $1,228 | $6,529 |
| 2013 | $4,190 | $8,663 | $1,228 | $7,435 |
Source: Public Records
Map
Nearby Homes
- 1513 Saint Charles Rd
- 35 S 16th Ave
- 1611 Saint Charles Rd
- 126 S 12th Ave
- 234 S 12th Ave
- 105 N 12th Ave
- 230 S 11th Ave
- 115 S 20th Ave
- 36 S 19th Ave Unit 2E
- 419 S 18th Ave
- 1619 Washington Blvd
- 133 N 17th Ave
- 406 S 10th Ave
- 220 S 9th Ave
- 626 S 14th Ave
- 628 S 15th Ave
- 640 S 14th Ave
- 214 22nd Ave
- 628 S 19th Ave
- 643 S 19th Ave
- 116 S 14th Ave
- 118 S 14th Ave
- 112 S 14th Ave
- 120 S 14th Ave
- 124 S 14th Ave
- 119 S 15th Ave
- 115 S 15th Ave
- 123 S 15th Ave
- 113 S 15th Ave
- 130 S 14th Ave
- 1414 St Charles Rd
- 1414 Saint Charles Rd
- 115 S 14th Ave
- 125 S 15th Ave
- 113 S 14th Ave
- 132 S 14th Ave
- 109 S 15th Ave
- 129 S 14th Ave
- 105 S 15th Ave
- 129 S 15th Ave