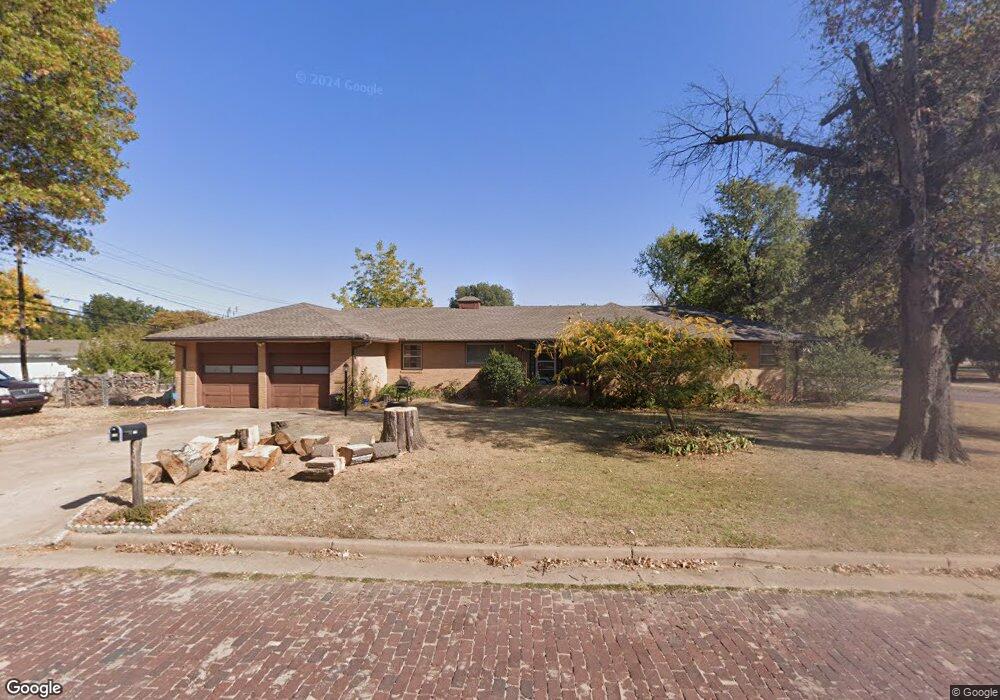
116 S E St Blackwell, OK 74631
Estimated Value: $101,000 - $141,000
3
Beds
2
Baths
1,653
Sq Ft
$73/Sq Ft
Est. Value
About This Home
This home is located at 116 S E St, Blackwell, OK 74631 and is currently estimated at $119,858, approximately $72 per square foot. 116 S E St is a home located in Kay County with nearby schools including Blackwell Elementary School, Blackwell Middle School, and Blackwell High School.
Ownership History
Date
Name
Owned For
Owner Type
Purchase Details
Closed on
Feb 27, 2018
Sold by
Bonewell Curtis D and Bonewell Phyllis J
Bought by
Pawlikowski Joseph R
Current Estimated Value
Home Financials for this Owner
Home Financials are based on the most recent Mortgage that was taken out on this home.
Original Mortgage
$85,858
Outstanding Balance
$72,471
Interest Rate
4.04%
Mortgage Type
New Conventional
Estimated Equity
$47,387
Purchase Details
Closed on
May 16, 2007
Sold by
Youell Arthene and Lawrence Youell W
Bought by
Youell Gary R and Youell Jimmy R
Purchase Details
Closed on
May 10, 2007
Sold by
Youell Gary R and Youell Kris
Bought by
Bonewell Curtis D and Bonewell Phyllis J
Purchase Details
Closed on
Dec 15, 2004
Sold by
Opal A Youell
Bought by
Opala Youell(Le) Etal 2
Create a Home Valuation Report for This Property
The Home Valuation Report is an in-depth analysis detailing your home's value as well as a comparison with similar homes in the area
Home Values in the Area
Average Home Value in this Area
Purchase History
| Date | Buyer | Sale Price | Title Company |
|---|---|---|---|
| Pawlikowski Joseph R | $80,000 | Stewart Escrow & Title | |
| Youell Gary R | -- | -- | |
| Bonewell Curtis D | $75,000 | -- | |
| Bonewell Curtis O | $75,000 | -- | |
| Opala Youell(Le) Etal 2 | -- | -- |
Source: Public Records
Mortgage History
| Date | Status | Borrower | Loan Amount |
|---|---|---|---|
| Open | Pawlikowski Joseph R | $85,858 |
Source: Public Records
Tax History
| Year | Tax Paid | Tax Assessment Tax Assessment Total Assessment is a certain percentage of the fair market value that is determined by local assessors to be the total taxable value of land and additions on the property. | Land | Improvement |
|---|---|---|---|---|
| 2025 | $940 | $9,855 | $693 | $9,162 |
| 2024 | $907 | $9,568 | $1,178 | $8,390 |
| 2023 | $907 | $9,290 | $1,178 | $8,112 |
| 2022 | $830 | $9,019 | $1,178 | $7,841 |
| 2021 | $845 | $9,019 | $1,178 | $7,841 |
| 2020 | $844 | $9,019 | $1,178 | $7,841 |
| 2019 | $832 | $8,800 | $1,178 | $7,622 |
| 2018 | $621 | $7,766 | $901 | $6,865 |
| 2017 | $644 | $7,766 | $901 | $6,865 |
| 2016 | $634 | $7,938 | $901 | $7,037 |
| 2015 | $629 | $7,893 | $901 | $6,992 |
| 2014 | $641 | $7,881 | $901 | $6,980 |
Source: Public Records
Map
Nearby Homes
- 649 E Blackwell Ave
- 504 E Padon Ave
- 438 E Blackwell Ave
- 0000 E Lincoln Ave
- 210 E Lincoln Ave
- 522 W Blackwell Ave
- 1300 S E St
- 520 W Kansas Ave
- 703 N 4th St
- 520 E Coolidge Ave
- 1405 S D St
- 1314 S 2nd St
- 816 W Padon Ave
- 919 W Padon Ave
- 119 Enlow Ave
- 1002 S 9th St
- 921 N 8th St
- 1301 W College Ave
- 1004 S 11th St
- 1330 S 9th St
- 610 E Bridge Ave
- 612 E Bridge Ave
- 117 S E St
- 616 E Bridge Ave
- 601 E Blackwell Ave
- 609 E Blackwell Ave
- 516 E Bridge Ave
- 626 E Bridge Ave
- 523 E Bridge Ave
- 519 E Blackwell Ave
- 615 E Blackwell Ave
- 519 E Bridge Ave
- 510 E Bridge Ave
- 628 E Bridge Ave
- 515 E Blackwell Ave
- 625 E Blackwell Ave
- 509 E Bridge Ave
- 608 E Blackwell Ave
- 104 N E St
- 632 E Bridge Ave
Your Personal Tour Guide
Ask me questions while you tour the home.