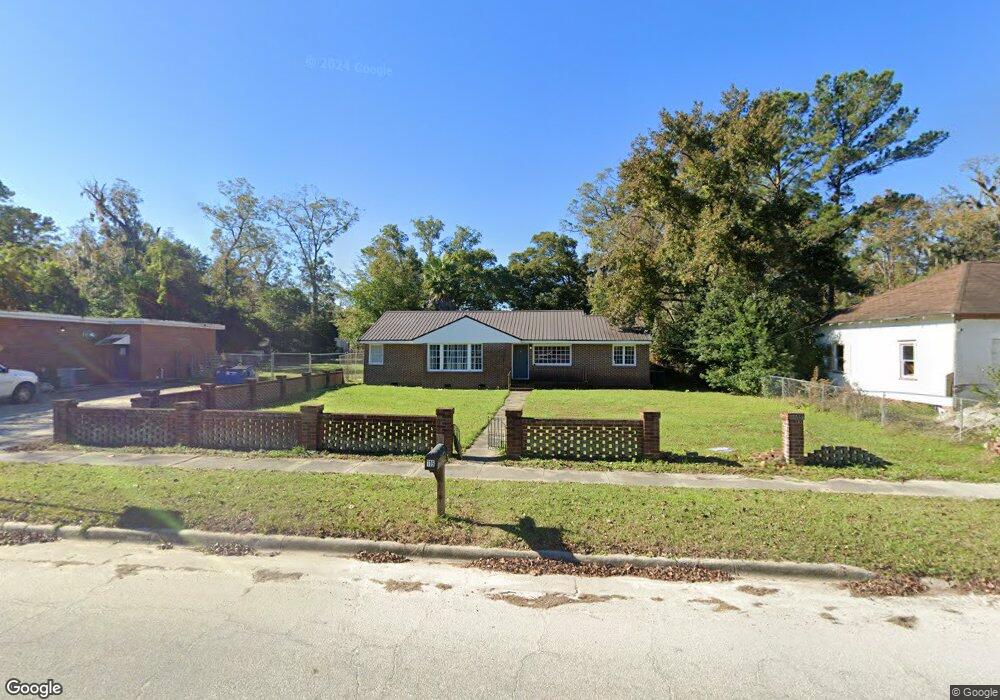
116 S Main St Ludowici, GA 31316
Estimated Value: $81,000 - $220,000
4
Beds
2
Baths
1,948
Sq Ft
$82/Sq Ft
Est. Value
About This Home
This home is located at 116 S Main St, Ludowici, GA 31316 and is currently estimated at $158,969, approximately $81 per square foot. 116 S Main St is a home with nearby schools including Smiley Elementary School, McClelland Elementary School, and Long County High School.
Ownership History
Date
Name
Owned For
Owner Type
Purchase Details
Closed on
May 16, 2022
Sold by
Deloach Lonnie
Bought by
Ludowici Land Co Llc
Current Estimated Value
Home Financials for this Owner
Home Financials are based on the most recent Mortgage that was taken out on this home.
Original Mortgage
$36,600
Outstanding Balance
$13,227
Interest Rate
5%
Mortgage Type
New Conventional
Estimated Equity
$145,742
Purchase Details
Closed on
Jan 20, 2011
Sold by
Manning Tara R
Bought by
Deloach Lonnie E and Deloach Kim
Purchase Details
Closed on
Nov 17, 2010
Sold by
Hallman Gene
Bought by
Deloach Kim and Folker Carla
Purchase Details
Closed on
Sep 13, 2002
Sold by
Steven M Maples
Bought by
Hallman Gene
Purchase Details
Closed on
Jan 3, 2001
Sold by
Option One Mortgage
Bought by
Steven M Maples
Purchase Details
Closed on
Jul 6, 1999
Sold by
Fowler Helen
Bought by
Shempart Joe and Shempart Crystal
Purchase Details
Closed on
Aug 1, 1990
Sold by
Folsom Rosalind Camilla
Bought by
Fowler Helen
Create a Home Valuation Report for This Property
The Home Valuation Report is an in-depth analysis detailing your home's value as well as a comparison with similar homes in the area
Home Values in the Area
Average Home Value in this Area
Purchase History
| Date | Buyer | Sale Price | Title Company |
|---|---|---|---|
| Ludowici Land Co Llc | $70,000 | -- | |
| Deloach Lonnie E | $45,000 | -- | |
| Deloach Kim | -- | -- | |
| Hallman Gene | $53,000 | -- | |
| Steven M Maples | $46,700 | -- | |
| Shempart Joe | -- | -- | |
| Fowler Helen | -- | -- |
Source: Public Records
Mortgage History
| Date | Status | Borrower | Loan Amount |
|---|---|---|---|
| Open | Ludowici Land Co Llc | $36,600 |
Source: Public Records
Tax History Compared to Growth
Tax History
| Year | Tax Paid | Tax Assessment Tax Assessment Total Assessment is a certain percentage of the fair market value that is determined by local assessors to be the total taxable value of land and additions on the property. | Land | Improvement |
|---|---|---|---|---|
| 2024 | $1,202 | $25,253 | $1,415 | $23,838 |
| 2023 | $953 | $25,253 | $1,415 | $23,838 |
| 2022 | $776 | $25,253 | $1,415 | $23,838 |
| 2021 | $865 | $27,387 | $1,415 | $25,972 |
| 2020 | $870 | $27,387 | $1,415 | $25,972 |
| 2019 | $870 | $27,387 | $1,415 | $25,972 |
| 2018 | $871 | $27,387 | $1,415 | $25,972 |
| 2017 | $871 | $27,387 | $1,415 | $25,972 |
| 2016 | $843 | $27,387 | $1,415 | $25,972 |
| 2015 | -- | $27,386 | $1,414 | $25,972 |
| 2014 | -- | $27,387 | $1,415 | $25,972 |
| 2013 | -- | $27,386 | $1,414 | $25,972 |
Source: Public Records
Map
Nearby Homes