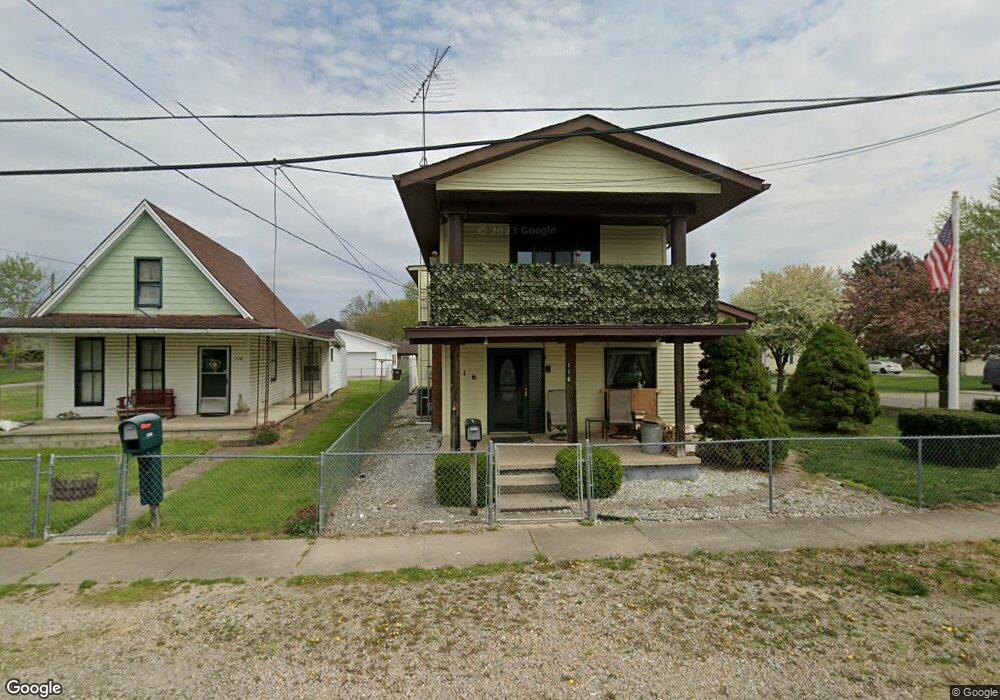
116 S Webb St Newark, OH 43055
Estimated Value: $150,000 - $186,063
3
Beds
1
Bath
2,043
Sq Ft
$81/Sq Ft
Est. Value
About This Home
This home is located at 116 S Webb St, Newark, OH 43055 and is currently estimated at $166,266, approximately $81 per square foot. 116 S Webb St is a home located in Licking County with nearby schools including Ben Franklin Elementary School, Heritage Middle School, and Newark High School.
Ownership History
Date
Name
Owned For
Owner Type
Purchase Details
Closed on
Apr 7, 2022
Sold by
Dupler Jolene E
Bought by
Mcclain Joseph Brandon
Current Estimated Value
Home Financials for this Owner
Home Financials are based on the most recent Mortgage that was taken out on this home.
Original Mortgage
$99,600
Outstanding Balance
$92,522
Interest Rate
3.89%
Mortgage Type
New Conventional
Estimated Equity
$73,744
Purchase Details
Closed on
May 28, 2014
Sold by
Hottinger Jerry J and Hottinger Jerry
Bought by
Hottinger Jerry J and Dupler Jolene E
Create a Home Valuation Report for This Property
The Home Valuation Report is an in-depth analysis detailing your home's value as well as a comparison with similar homes in the area
Home Values in the Area
Average Home Value in this Area
Purchase History
| Date | Buyer | Sale Price | Title Company |
|---|---|---|---|
| Mcclain Joseph Brandon | -- | Chicago Title | |
| Hottinger Jerry J | -- | None Available |
Source: Public Records
Mortgage History
| Date | Status | Borrower | Loan Amount |
|---|---|---|---|
| Open | Mcclain Joseph Brandon | $99,600 |
Source: Public Records
Tax History
| Year | Tax Paid | Tax Assessment Tax Assessment Total Assessment is a certain percentage of the fair market value that is determined by local assessors to be the total taxable value of land and additions on the property. | Land | Improvement |
|---|---|---|---|---|
| 2024 | $1,380 | $38,640 | $5,110 | $33,530 |
| 2023 | $1,380 | $38,640 | $5,110 | $33,530 |
| 2022 | $977 | $33,190 | $2,980 | $30,210 |
| 2021 | $957 | $31,580 | $1,370 | $30,210 |
| 2020 | $1,355 | $31,580 | $1,370 | $30,210 |
| 2019 | $1,164 | $26,150 | $980 | $25,170 |
| 2018 | $1,165 | $0 | $0 | $0 |
| 2017 | $1,072 | $0 | $0 | $0 |
| 2016 | $1,001 | $0 | $0 | $0 |
| 2015 | $1,022 | $0 | $0 | $0 |
| 2014 | $302 | $0 | $0 | $0 |
| 2013 | $294 | $0 | $0 | $0 |
Source: Public Records
Map
Nearby Homes
Your Personal Tour Guide
Ask me questions while you tour the home.