Estimated Value: $377,889 - $444,000
3
Beds
2
Baths
2,115
Sq Ft
$197/Sq Ft
Est. Value
About This Home
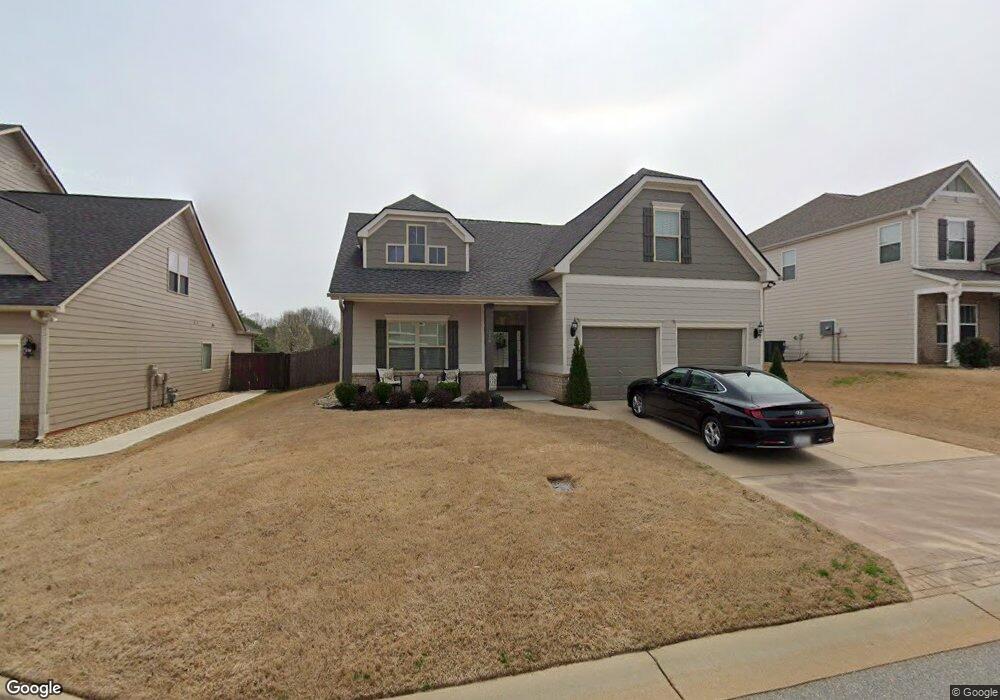
This home is located at 116 Sandpine Way Unit AC 54 - Greystone T, Greer, SC 29651 and is currently estimated at $417,472, approximately $197 per square foot. 116 Sandpine Way Unit AC 54 - Greystone T is a home located in Greenville County with nearby schools including Abner Creek Academy, Byrnes Freshman Academy, and Berry Shoals Intermediate School.
Ownership History
Date
Name
Owned For
Owner Type
Purchase Details
Closed on
Sep 1, 2023
Sold by
Chermak Maria
Bought by
Chermak Maria and Pena Michelle
Current Estimated Value
Purchase Details
Closed on
Jun 2, 2023
Sold by
Chermak Mark Joseph
Bought by
Chermak Maria
Purchase Details
Closed on
Feb 24, 2021
Sold by
Hancock Nicholas and Hancock Lisa
Bought by
Chermak Mark
Home Financials for this Owner
Home Financials are based on the most recent Mortgage that was taken out on this home.
Original Mortgage
$265,050
Interest Rate
2.7%
Mortgage Type
New Conventional
Purchase Details
Closed on
Oct 24, 2018
Sold by
Mancuso Janice M
Bought by
Hancock Nicholas and Hancock Lisa
Home Financials for this Owner
Home Financials are based on the most recent Mortgage that was taken out on this home.
Original Mortgage
$247,410
Interest Rate
4.7%
Mortgage Type
New Conventional
Create a Home Valuation Report for This Property
The Home Valuation Report is an in-depth analysis detailing your home's value as well as a comparison with similar homes in the area
Home Values in the Area
Average Home Value in this Area
Purchase History
| Date | Buyer | Sale Price | Title Company |
|---|---|---|---|
| Chermak Maria | -- | None Listed On Document | |
| Chermak Maria | -- | None Listed On Document | |
| Chermak Mark | $279,000 | None Available | |
| Hancock Nicholas | $274,900 | None Available |
Source: Public Records
Mortgage History
| Date | Status | Borrower | Loan Amount |
|---|---|---|---|
| Previous Owner | Chermak Mark | $265,050 | |
| Previous Owner | Hancock Nicholas | $247,410 |
Source: Public Records
Tax History Compared to Growth
Tax History
| Year | Tax Paid | Tax Assessment Tax Assessment Total Assessment is a certain percentage of the fair market value that is determined by local assessors to be the total taxable value of land and additions on the property. | Land | Improvement |
|---|---|---|---|---|
| 2025 | $3,269 | $13,956 | $2,100 | $11,856 |
| 2024 | $3,269 | $13,956 | $2,100 | $11,856 |
| 2023 | $3,269 | $19,251 | $2,897 | $16,354 |
| 2022 | $2,555 | $11,160 | $2,100 | $9,060 |
| 2021 | $2,487 | $10,984 | $2,100 | $8,884 |
| 2020 | $2,438 | $10,984 | $2,100 | $8,884 |
| 2019 | $2,432 | $10,814 | $2,084 | $8,730 |
| 2018 | $2,340 | $10,814 | $2,084 | $8,730 |
| 2017 | $2,015 | $9,404 | $2,100 | $7,304 |
| 2016 | $1,968 | $9,404 | $2,100 | $7,304 |
| 2015 | $1,394 | $3,150 | $3,150 | $0 |
| 2014 | $414 | $780 | $780 | $0 |
Source: Public Records
Map
Nearby Homes
- 238 Braselton St
- 126 Mayfield Crossing Ln
- 171 Ralston Rd
- 1074 Nadine Way
- 1313 Algeddis Dr
- 329 Elwin Ln
- 1228 Cyndis Ln
- 401 State Road S-42-653
- 0 Leonard Rd Unit 2518500
- 0 Leonard Rd Unit 1564811
- 2396 Abner Creek Rd
- 1305 Ledsham Ct
- 812 Kist Rd
- 202 Princeton Dr
- 300 Liberty Hill Rd
- 320 Liberty Hill Rd
- 2444 Abner Creek Rd
- 7 Danielsen Way
- 182 Crisp Cameo Ct
- 409 Merkel Dr
- 116 Sandpine Way Unit Greer
- 116 Sandpine Way
- 120 Sandpine Way Unit AC 53- Roxbury S
- 120 Sandpine Way
- 112 Sandpine Way
- 119 Sandpine Way
- 108 Sandpine Way
- 202 Delbourne Ln
- 124 Sandpine Way
- 128 Sandpine Way Unit AC 51 - Avondale S
- 128 Sandpine Way
- 104 Sandpine Way
- 206 Delbourne Ln Unit AC 60- Parkside T
- 206 Delbourne Ln
- 505 Grandon Rd
- 1751 Abner Creek Rd
- 201 Delbourne Ln
- 501 Grandon Rd
- 132 Sandpine Way
- 509 Grandon Rd