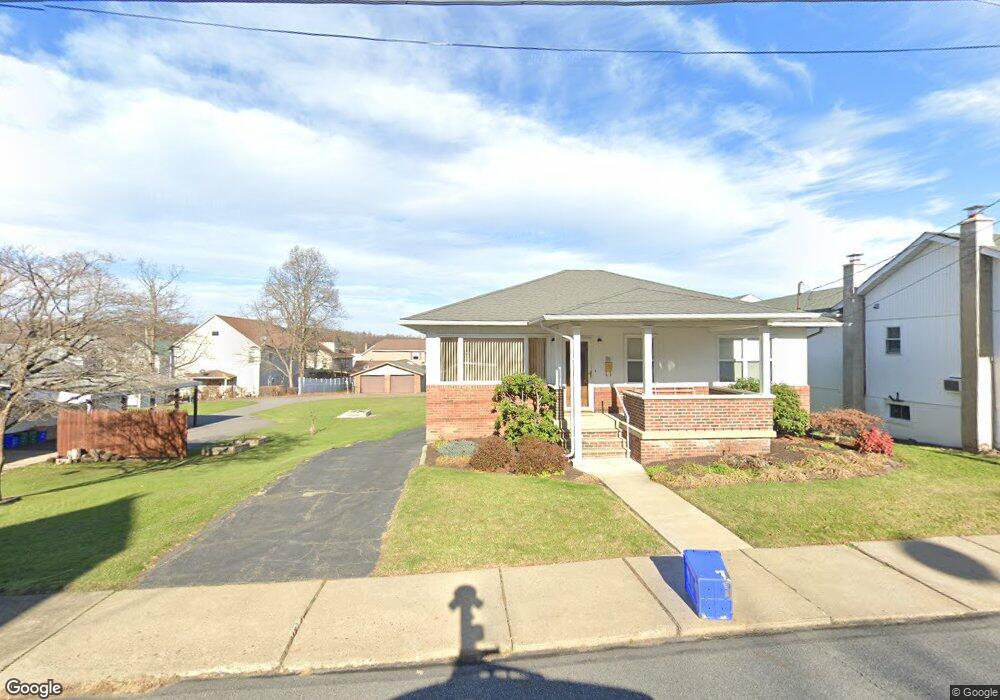
116 Smith St Dupont, PA 18641
Estimated Value: $147,000 - $184,000
--
Bed
--
Bath
1,120
Sq Ft
$144/Sq Ft
Est. Value
About This Home
This home is located at 116 Smith St, Dupont, PA 18641 and is currently estimated at $160,922, approximately $143 per square foot. 116 Smith St is a home located in Luzerne County with nearby schools including Pittston City Intermediate Center, Pittston Area Middle School, and Frederick County Middle School.
Ownership History
Date
Name
Owned For
Owner Type
Purchase Details
Closed on
Oct 25, 2022
Sold by
Joyce Ann
Bought by
Avvisato Robert P
Current Estimated Value
Home Financials for this Owner
Home Financials are based on the most recent Mortgage that was taken out on this home.
Original Mortgage
$168,795
Outstanding Balance
$163,317
Interest Rate
6.7%
Mortgage Type
VA
Estimated Equity
-$2,395
Purchase Details
Closed on
Oct 13, 2016
Sold by
Iannuzzo Lucy
Bought by
Marie Joyce Ann and Marie Hop Marie O
Purchase Details
Closed on
Apr 4, 1978
Bought by
Iannuzzo Albert and Iannuzzo Lucy
Create a Home Valuation Report for This Property
The Home Valuation Report is an in-depth analysis detailing your home's value as well as a comparison with similar homes in the area
Home Values in the Area
Average Home Value in this Area
Purchase History
| Date | Buyer | Sale Price | Title Company |
|---|---|---|---|
| Avvisato Robert P | $165,000 | -- | |
| Marie Joyce Ann | -- | None Available | |
| Iannuzzo Albert | -- | -- |
Source: Public Records
Mortgage History
| Date | Status | Borrower | Loan Amount |
|---|---|---|---|
| Open | Avvisato Robert P | $168,795 |
Source: Public Records
Tax History Compared to Growth
Tax History
| Year | Tax Paid | Tax Assessment Tax Assessment Total Assessment is a certain percentage of the fair market value that is determined by local assessors to be the total taxable value of land and additions on the property. | Land | Improvement |
|---|---|---|---|---|
| 2025 | $1,443 | $58,600 | $21,200 | $37,400 |
| 2024 | $1,443 | $58,600 | $21,200 | $37,400 |
| 2023 | $1,443 | $58,600 | $21,200 | $37,400 |
| 2022 | $1,432 | $58,600 | $21,200 | $37,400 |
| 2021 | $1,432 | $58,600 | $21,200 | $37,400 |
| 2020 | $1,399 | $58,600 | $21,200 | $37,400 |
| 2019 | $1,388 | $58,600 | $21,200 | $37,400 |
| 2018 | $1,359 | $58,600 | $21,200 | $37,400 |
| 2017 | $1,300 | $58,600 | $21,200 | $37,400 |
| 2016 | -- | $58,600 | $21,200 | $37,400 |
| 2015 | $989 | $58,600 | $21,200 | $37,400 |
| 2014 | $989 | $58,600 | $21,200 | $37,400 |
Source: Public Records
Map
Nearby Homes