Estimated Value: $343,000 - $417,000
5
Beds
3
Baths
1,704
Sq Ft
$219/Sq Ft
Est. Value
About This Home
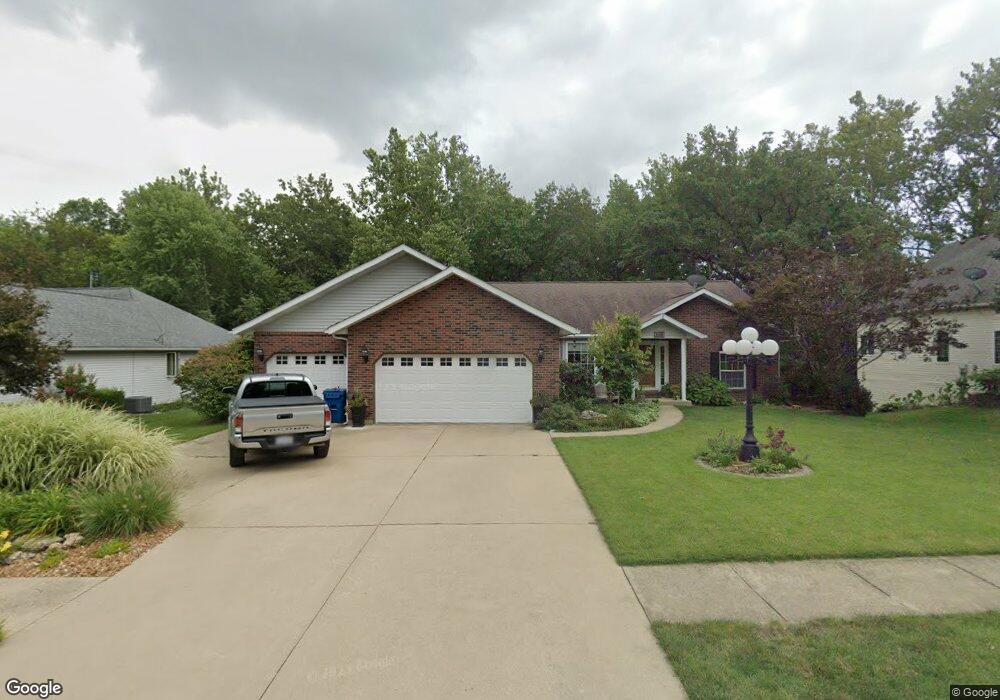
This home is located at 116 Steven Dr, Troy, IL 62294 and is currently estimated at $372,965, approximately $218 per square foot. 116 Steven Dr is a home located in Madison County with nearby schools including Henning Elementary School, Triad Middle School, and Triad High School.
Ownership History
Date
Name
Owned For
Owner Type
Purchase Details
Closed on
Apr 15, 2021
Sold by
Galaske James W and Galaske Claudia
Bought by
Galaske James W and Galaske Glaudia
Current Estimated Value
Home Financials for this Owner
Home Financials are based on the most recent Mortgage that was taken out on this home.
Original Mortgage
$154,000
Outstanding Balance
$136,286
Interest Rate
2.5%
Mortgage Type
New Conventional
Estimated Equity
$236,679
Purchase Details
Closed on
May 11, 2005
Sold by
Wooliver Charles T and Wooliver Jo A
Bought by
Galaske James W and Carmichael Claudia L
Home Financials for this Owner
Home Financials are based on the most recent Mortgage that was taken out on this home.
Original Mortgage
$243,500
Interest Rate
6.13%
Mortgage Type
Fannie Mae Freddie Mac
Create a Home Valuation Report for This Property
The Home Valuation Report is an in-depth analysis detailing your home's value as well as a comparison with similar homes in the area
Home Values in the Area
Average Home Value in this Area
Purchase History
| Date | Buyer | Sale Price | Title Company |
|---|---|---|---|
| Galaske James W | -- | None Available | |
| Galaske James W | $243,500 | Mctc |
Source: Public Records
Mortgage History
| Date | Status | Borrower | Loan Amount |
|---|---|---|---|
| Open | Galaske James W | $154,000 | |
| Closed | Galaske James W | $243,500 |
Source: Public Records
Tax History
| Year | Tax Paid | Tax Assessment Tax Assessment Total Assessment is a certain percentage of the fair market value that is determined by local assessors to be the total taxable value of land and additions on the property. | Land | Improvement |
|---|---|---|---|---|
| 2024 | $6,718 | $102,170 | $22,430 | $79,740 |
| 2023 | $6,718 | $92,750 | $20,360 | $72,390 |
| 2022 | $6,227 | $85,410 | $18,750 | $66,660 |
| 2021 | $5,776 | $81,170 | $17,820 | $63,350 |
| 2020 | $5,778 | $79,070 | $17,360 | $61,710 |
| 2019 | $5,680 | $77,440 | $17,000 | $60,440 |
| 2018 | $5,555 | $71,750 | $15,750 | $56,000 |
| 2017 | $5,346 | $70,250 | $15,420 | $54,830 |
| 2016 | $6,100 | $79,890 | $14,710 | $65,180 |
| 2015 | $5,476 | $77,240 | $14,220 | $63,020 |
| 2014 | $5,476 | $77,240 | $14,220 | $63,020 |
| 2013 | $5,476 | $77,240 | $14,220 | $63,020 |
Source: Public Records
Map
Nearby Homes
- 207 E High St
- 706 Merlin Ct
- 313 S Park St
- 608 Sundance Trail
- 402 N Powell St
- 332 N Kimberlin St
- 65 Ashbrooke
- 208 E Throp St
- 103 Theresa Dr
- 18 Westbrooke
- 13 Sonata Ln
- 15 Sonata Ln
- xxx Lower Marine Rd
- Tbd Lower Marine Rd
- 306 Hazel St
- 2281 Staunton Rd
- 2261 Staunton Rd
- 2265 Staunton Rd
- 2289 Staunton Rd
- 2273 Staunton Rd
Your Personal Tour Guide
Ask me questions while you tour the home.