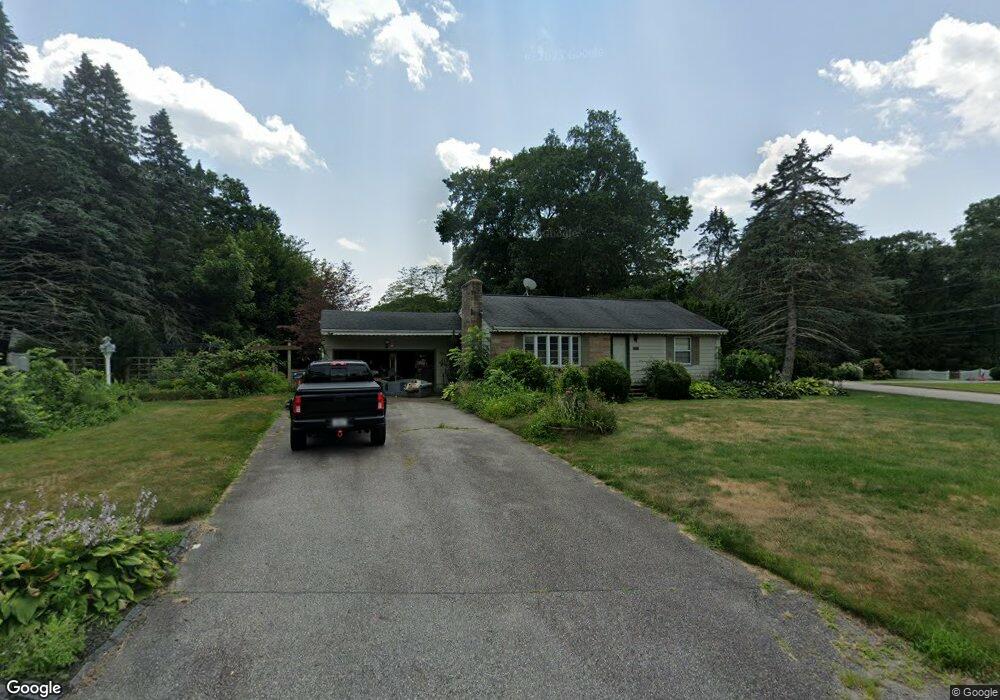
116 Tee Jay Dr Seekonk, MA 02771
Estimated Value: $476,895 - $516,000
2
Beds
1
Bath
1,488
Sq Ft
$331/Sq Ft
Est. Value
About This Home
This home is located at 116 Tee Jay Dr, Seekonk, MA 02771 and is currently estimated at $492,724, approximately $331 per square foot. 116 Tee Jay Dr is a home located in Bristol County with nearby schools including Seekonk High School, Ocean State Montessori School, and Providence Country Day School.
Ownership History
Date
Name
Owned For
Owner Type
Purchase Details
Closed on
Apr 3, 2012
Sold by
Calverley 4Th Charles A and Calverley Carol A
Bought by
Calverley Carol A
Current Estimated Value
Purchase Details
Closed on
Sep 27, 1995
Sold by
Nitterauer Irene C
Bought by
Calverley Charles and Calverley Carol A
Home Financials for this Owner
Home Financials are based on the most recent Mortgage that was taken out on this home.
Original Mortgage
$123,150
Interest Rate
7.89%
Mortgage Type
Purchase Money Mortgage
Create a Home Valuation Report for This Property
The Home Valuation Report is an in-depth analysis detailing your home's value as well as a comparison with similar homes in the area
Home Values in the Area
Average Home Value in this Area
Purchase History
| Date | Buyer | Sale Price | Title Company |
|---|---|---|---|
| Calverley Carol A | -- | -- | |
| Calverley Charles | $127,000 | -- |
Source: Public Records
Mortgage History
| Date | Status | Borrower | Loan Amount |
|---|---|---|---|
| Previous Owner | Calverley Charles | $35,000 | |
| Previous Owner | Calverley Charles | $25,000 | |
| Previous Owner | Calverley Charles | $123,150 |
Source: Public Records
Tax History
| Year | Tax Paid | Tax Assessment Tax Assessment Total Assessment is a certain percentage of the fair market value that is determined by local assessors to be the total taxable value of land and additions on the property. | Land | Improvement |
|---|---|---|---|---|
| 2025 | $4,828 | $390,900 | $188,000 | $202,900 |
| 2024 | $4,673 | $378,400 | $188,000 | $190,400 |
| 2023 | $4,412 | $336,500 | $168,900 | $167,600 |
| 2022 | $4,165 | $312,200 | $168,900 | $143,300 |
| 2021 | $3,873 | $285,400 | $144,900 | $140,500 |
| 2020 | $3,705 | $281,300 | $144,800 | $136,500 |
| 2019 | $3,614 | $276,700 | $144,800 | $131,900 |
| 2018 | $3,609 | $270,300 | $144,800 | $125,500 |
| 2017 | $3,532 | $262,400 | $146,400 | $116,000 |
| 2016 | $3,505 | $261,400 | $146,400 | $115,000 |
| 2015 | $3,153 | $238,300 | $132,900 | $105,400 |
Source: Public Records
Map
Nearby Homes
- 8 Agawam Ct
- 57 Mohawk Dr
- 11 Hawthorne Dr
- 454 Fall River Ave
- 30 Fuller St
- 0 N Wheaton Ave
- 44 Hope St
- 296 Fall River Ave
- 0 Milton St Unit 72633661
- 0 Wheaton Ave
- 205 Providence St Bldr Lot 3
- 203 Providence St Bldr Lot 5
- 67 Wheeler St
- 77 Gardiner Ave
- 26 Callender Ave
- 151 Dover Ave
- 177 Dover Ave
- 44 Charles St
- 29 Ide Ave
- 54 Raymond St
Your Personal Tour Guide
Ask me questions while you tour the home.