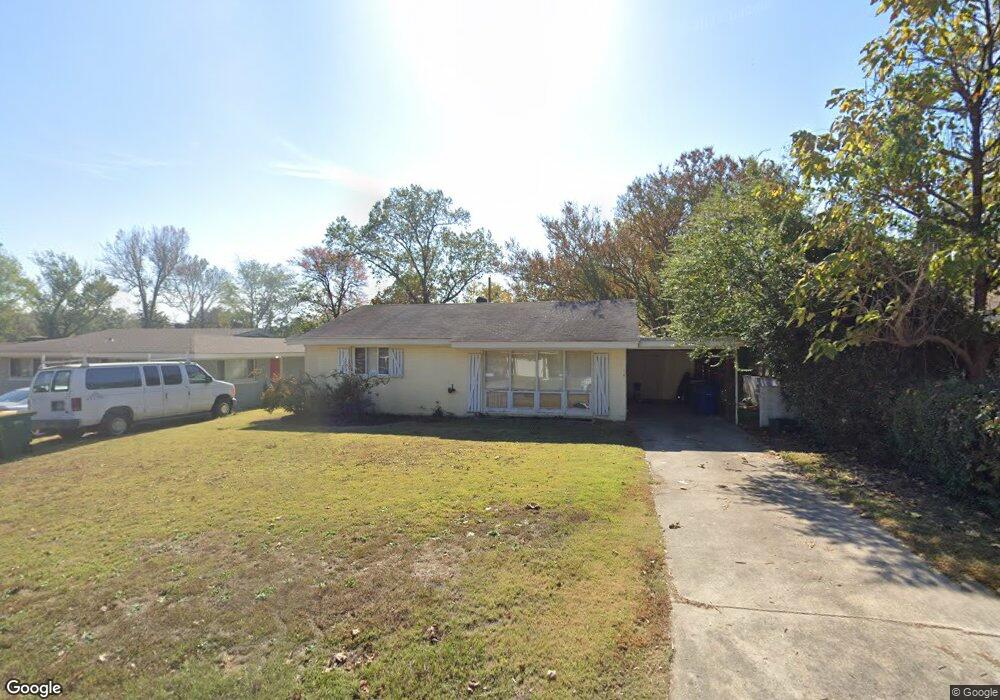
116 Texas Ave North Little Rock, AR 72118
Amboy NeighborhoodEstimated Value: $81,000 - $147,000
--
Bed
1
Bath
947
Sq Ft
$120/Sq Ft
Est. Value
About This Home
This home is located at 116 Texas Ave, North Little Rock, AR 72118 and is currently estimated at $113,650, approximately $120 per square foot. 116 Texas Ave is a home located in Pulaski County with nearby schools including Amboy Elementary School, North Little Rock Middle School 6th Grade Campus, and North Little Rock High School.
Ownership History
Date
Name
Owned For
Owner Type
Purchase Details
Closed on
May 6, 2013
Sold by
Pierson Mary B
Bought by
Trigg David J and Trigg Laura B
Current Estimated Value
Purchase Details
Closed on
Oct 27, 2009
Sold by
Pettus Amanda
Bought by
Cupit Justin
Home Financials for this Owner
Home Financials are based on the most recent Mortgage that was taken out on this home.
Original Mortgage
$32,402
Interest Rate
5.03%
Mortgage Type
FHA
Purchase Details
Closed on
Jul 12, 2004
Sold by
Ranch Properties Inc
Bought by
Jim Favre Construction Co
Home Financials for this Owner
Home Financials are based on the most recent Mortgage that was taken out on this home.
Original Mortgage
$268,600
Interest Rate
6.32%
Mortgage Type
Purchase Money Mortgage
Create a Home Valuation Report for This Property
The Home Valuation Report is an in-depth analysis detailing your home's value as well as a comparison with similar homes in the area
Home Values in the Area
Average Home Value in this Area
Purchase History
| Date | Buyer | Sale Price | Title Company |
|---|---|---|---|
| Trigg David J | -- | Multiple | |
| Cupit Justin | $33,000 | None Available | |
| Jim Favre Construction Co | $44,000 | American Abstract & Title Co |
Source: Public Records
Mortgage History
| Date | Status | Borrower | Loan Amount |
|---|---|---|---|
| Previous Owner | Cupit Justin | $32,402 | |
| Previous Owner | Jim Favre Construction Co | $268,600 |
Source: Public Records
Tax History Compared to Growth
Tax History
| Year | Tax Paid | Tax Assessment Tax Assessment Total Assessment is a certain percentage of the fair market value that is determined by local assessors to be the total taxable value of land and additions on the property. | Land | Improvement |
|---|---|---|---|---|
| 2025 | $897 | $16,008 | $2,500 | $13,508 |
| 2024 | $822 | $16,008 | $2,500 | $13,508 |
| 2023 | $822 | $16,008 | $2,500 | $13,508 |
| 2022 | $822 | $16,008 | $2,500 | $13,508 |
| 2021 | $748 | $11,190 | $2,300 | $8,890 |
| 2020 | $748 | $11,190 | $2,300 | $8,890 |
| 2019 | $748 | $11,190 | $2,300 | $8,890 |
| 2018 | $748 | $11,190 | $2,300 | $8,890 |
| 2017 | $748 | $11,190 | $2,300 | $8,890 |
| 2016 | $819 | $12,260 | $3,000 | $9,260 |
| 2015 | $819 | $12,260 | $3,000 | $9,260 |
| 2014 | $819 | $12,260 | $3,000 | $9,260 |
Source: Public Records
Map
Nearby Homes
- 702 E Military Dr
- 409 Harper Ln
- 4920 Lee St
- 2304 Ella Ct
- 5709 Shamrock Dr
- 1400 Nicole Dr
- 319 Wilson St
- 2215 Coors Dr
- 261 E Military Dr
- 5612 Division St
- 47 Sunset Dr
- Lot 87 Foxboro Dr
- Lot 86 Foxboro Dr
- Lot 85 Foxboro Dr
- Lot 84 Foxboro Dr
- Lot 83 Foxboro Dr
- Lot 82 Foxboro Dr
- Lot 96 Foxboro Dr
- Lot 95 Foxboro Dr
- Lot 90 Foxboro Dr