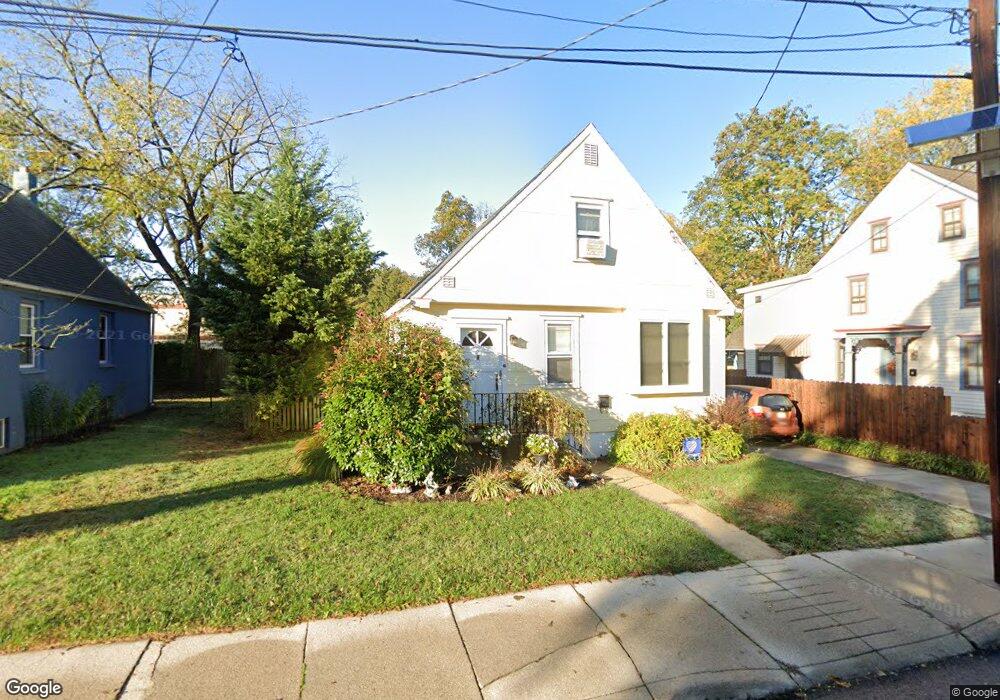
116 Union St Moorestown, NJ 08057
Estimated Value: $271,381 - $385,000
--
Bed
--
Bath
1,156
Sq Ft
$295/Sq Ft
Est. Value
About This Home
This home is located at 116 Union St, Moorestown, NJ 08057 and is currently estimated at $341,095, approximately $295 per square foot. 116 Union St is a home located in Burlington County with nearby schools including George C. Baker Elementary School, Moorestown Upper Elementary School, and William Allen Middle School.
Ownership History
Date
Name
Owned For
Owner Type
Purchase Details
Closed on
May 25, 2001
Sold by
Jaggard R Thomas and Jaggard Kathleen A
Bought by
Jaggard Kathleen A
Current Estimated Value
Home Financials for this Owner
Home Financials are based on the most recent Mortgage that was taken out on this home.
Original Mortgage
$108,750
Outstanding Balance
$40,787
Interest Rate
7.09%
Estimated Equity
$300,308
Purchase Details
Closed on
Oct 23, 1998
Sold by
Travor Scott David and Travor Sandra Ann
Bought by
Jaggard R Thomas and Jaggard Kathleen A
Home Financials for this Owner
Home Financials are based on the most recent Mortgage that was taken out on this home.
Original Mortgage
$100,000
Interest Rate
6.49%
Purchase Details
Closed on
Jun 30, 1994
Sold by
Mollo Susan D
Bought by
Travor Scott David and Travor Sandra Ann
Create a Home Valuation Report for This Property
The Home Valuation Report is an in-depth analysis detailing your home's value as well as a comparison with similar homes in the area
Home Values in the Area
Average Home Value in this Area
Purchase History
| Date | Buyer | Sale Price | Title Company |
|---|---|---|---|
| Jaggard Kathleen A | -- | Infinity Title Agency Inc | |
| Jaggard R Thomas | $125,000 | Infinity Title Agency Inc | |
| Travor Scott David | $120,000 | Fidelity National Title Ins |
Source: Public Records
Mortgage History
| Date | Status | Borrower | Loan Amount |
|---|---|---|---|
| Open | Jaggard Kathleen A | $108,750 | |
| Closed | Jaggard R Thomas | $100,000 |
Source: Public Records
Tax History Compared to Growth
Tax History
| Year | Tax Paid | Tax Assessment Tax Assessment Total Assessment is a certain percentage of the fair market value that is determined by local assessors to be the total taxable value of land and additions on the property. | Land | Improvement |
|---|---|---|---|---|
| 2025 | $4,009 | $141,300 | $75,800 | $65,500 |
| 2024 | $3,887 | $141,300 | $75,800 | $65,500 |
| 2023 | $3,887 | $141,300 | $75,800 | $65,500 |
| 2022 | $3,848 | $141,300 | $75,800 | $65,500 |
| 2021 | $3,797 | $141,300 | $75,800 | $65,500 |
| 2020 | $3,773 | $141,300 | $75,800 | $65,500 |
| 2019 | $3,706 | $141,300 | $75,800 | $65,500 |
| 2018 | $3,606 | $141,300 | $75,800 | $65,500 |
| 2017 | $3,637 | $141,300 | $75,800 | $65,500 |
| 2016 | $3,624 | $141,300 | $75,800 | $65,500 |
| 2015 | $3,581 | $141,300 | $75,800 | $65,500 |
| 2014 | $3,400 | $141,300 | $75,800 | $65,500 |
Source: Public Records
Map
Nearby Homes