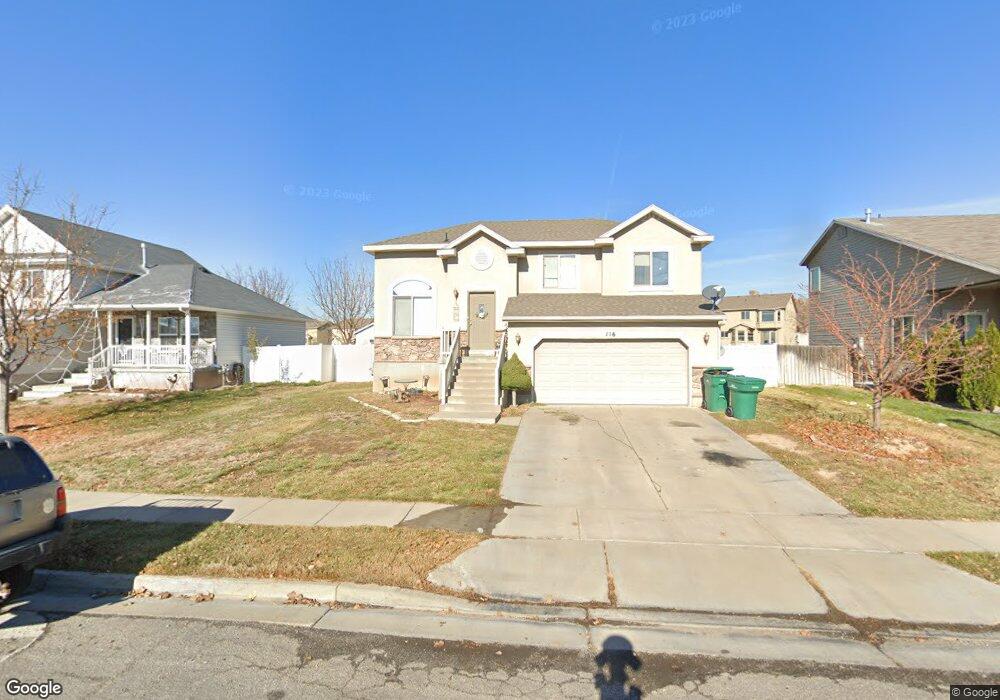
116 W 1675 N Layton, UT 84041
Estimated Value: $443,000 - $489,000
3
Beds
2
Baths
1,951
Sq Ft
$240/Sq Ft
Est. Value
About This Home
This home is located at 116 W 1675 N, Layton, UT 84041 and is currently estimated at $468,446, approximately $240 per square foot. 116 W 1675 N is a home located in Davis County with nearby schools including Lincoln Elementary School, North Layton Junior High School, and Northridge High School.
Ownership History
Date
Name
Owned For
Owner Type
Purchase Details
Closed on
Mar 29, 2021
Sold by
Duberow Bryan F and Duberow Loretta A
Bought by
Duberow Bryan F and Duberow Loretta A
Current Estimated Value
Purchase Details
Closed on
Jan 30, 2013
Sold by
Duberow Bryan F and Duberow Loretta A
Bought by
Duberow Bryan F and Duberow Loretta A
Purchase Details
Closed on
Aug 22, 2006
Sold by
Duberow Bryan F and Duberow Loretta A
Bought by
Duberow Bryan F and Duberow Loretta A
Purchase Details
Closed on
Sep 23, 2005
Sold by
North Ivory
Bought by
Duberon Bryan F and Duberon Loretta A
Home Financials for this Owner
Home Financials are based on the most recent Mortgage that was taken out on this home.
Original Mortgage
$131,064
Outstanding Balance
$69,546
Interest Rate
5.72%
Mortgage Type
Fannie Mae Freddie Mac
Estimated Equity
$398,900
Create a Home Valuation Report for This Property
The Home Valuation Report is an in-depth analysis detailing your home's value as well as a comparison with similar homes in the area
Home Values in the Area
Average Home Value in this Area
Purchase History
| Date | Buyer | Sale Price | Title Company |
|---|---|---|---|
| Duberow Bryan F | -- | Novare National Se | |
| Duberow Bryan F | -- | Chicago Title Servicelink Di | |
| Duberow Bryan F | -- | Accommodation | |
| Duberon Bryan F | -- | Cottonwood Title Ins Agency |
Source: Public Records
Mortgage History
| Date | Status | Borrower | Loan Amount |
|---|---|---|---|
| Open | Duberon Bryan F | $131,064 |
Source: Public Records
Tax History
| Year | Tax Paid | Tax Assessment Tax Assessment Total Assessment is a certain percentage of the fair market value that is determined by local assessors to be the total taxable value of land and additions on the property. | Land | Improvement |
|---|---|---|---|---|
| 2025 | $2,232 | $234,300 | $89,910 | $144,390 |
| 2024 | $2,138 | $226,049 | $105,447 | $120,602 |
| 2023 | $2,205 | $226,050 | $72,540 | $153,509 |
| 2022 | $2,239 | $226,600 | $67,764 | $158,836 |
| 2021 | $2,040 | $308,000 | $90,054 | $217,946 |
| 2020 | $1,830 | $265,000 | $77,849 | $187,151 |
| 2019 | $1,791 | $254,000 | $75,880 | $178,120 |
| 2018 | $1,629 | $232,000 | $75,880 | $156,120 |
| 2016 | $1,461 | $107,305 | $22,884 | $84,421 |
| 2015 | $1,488 | $103,785 | $22,884 | $80,901 |
| 2014 | $1,491 | $106,310 | $22,884 | $83,426 |
| 2013 | -- | $105,011 | $31,103 | $73,908 |
Source: Public Records
Map
Nearby Homes
- 108 W 1675 N
- 1721 Arnold Dr
- 140 W 1675 N
- 1729 Arnold Dr
- 1657 N 125 W
- 158 W 1675 N
- 32 W 1675 N
- 1751 N Belvedere Way
- 1759 N Belvedere Way
- 1733 Arnold Dr Unit 203
- 1658 N 125 W
- 1640 N 125 W
- 1761 N Belvedere Way
- 24 W 1675 N
- 1763 N Belvedere Way
- 1641 N 125 W
- 35 W 1675 N
- 160 W 1675 N
- 49 W Belvedere Way
- 29 W 1675 N
Your Personal Tour Guide
Ask me questions while you tour the home.