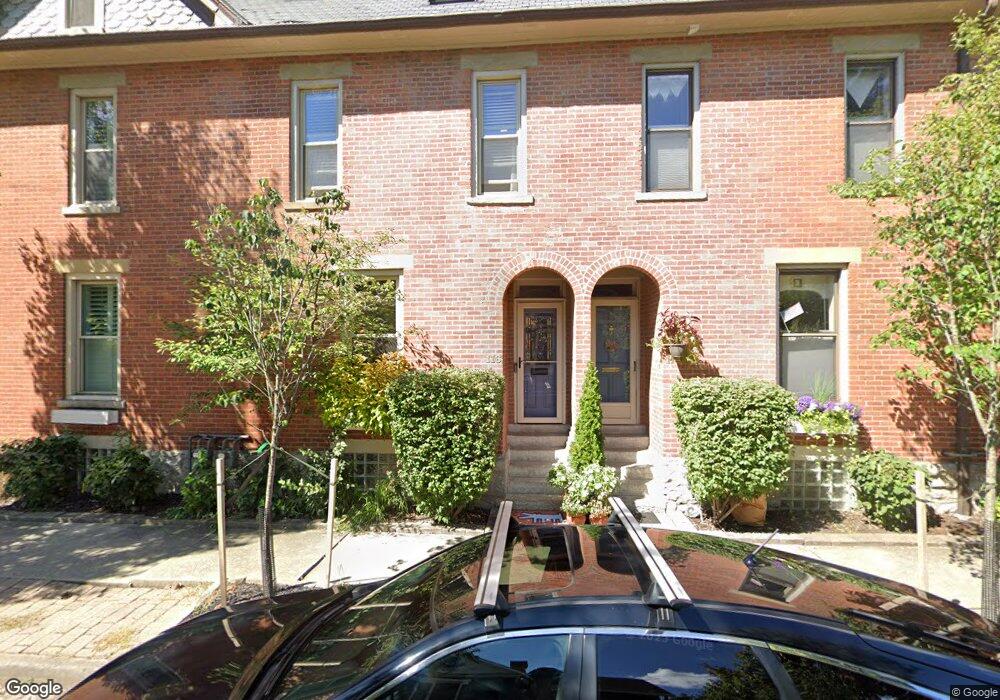
116 W 6th Ave Columbus, OH 43201
Dennison Place NeighborhoodEstimated Value: $288,000 - $378,000
2
Beds
2
Baths
1,349
Sq Ft
$254/Sq Ft
Est. Value
About This Home
This home is located at 116 W 6th Ave, Columbus, OH 43201 and is currently estimated at $342,725, approximately $254 per square foot. 116 W 6th Ave is a home located in Franklin County with nearby schools including Hubbard Elementary School, Dominion Middle School, and Whetstone High School.
Ownership History
Date
Name
Owned For
Owner Type
Purchase Details
Closed on
Oct 11, 2021
Sold by
Grant David A
Bought by
Carte Brandon Michael
Current Estimated Value
Home Financials for this Owner
Home Financials are based on the most recent Mortgage that was taken out on this home.
Original Mortgage
$280,250
Outstanding Balance
$255,562
Interest Rate
2.8%
Mortgage Type
New Conventional
Estimated Equity
$87,163
Purchase Details
Closed on
Aug 1, 1996
Sold by
Weaver Karen
Bought by
David A Grant
Home Financials for this Owner
Home Financials are based on the most recent Mortgage that was taken out on this home.
Original Mortgage
$78,000
Interest Rate
8.33%
Mortgage Type
New Conventional
Purchase Details
Closed on
Dec 29, 1995
Sold by
Freeze James Lindsey
Bought by
Karen Weaver
Home Financials for this Owner
Home Financials are based on the most recent Mortgage that was taken out on this home.
Original Mortgage
$113,050
Interest Rate
7.42%
Mortgage Type
New Conventional
Purchase Details
Closed on
Aug 24, 1993
Create a Home Valuation Report for This Property
The Home Valuation Report is an in-depth analysis detailing your home's value as well as a comparison with similar homes in the area
Home Values in the Area
Average Home Value in this Area
Purchase History
| Date | Buyer | Sale Price | Title Company |
|---|---|---|---|
| Carte Brandon Michael | $295,000 | Northwest Select Ttl Agcy Ll | |
| David A Grant | $128,000 | -- | |
| Karen Weaver | $119,000 | -- | |
| -- | $103,700 | -- |
Source: Public Records
Mortgage History
| Date | Status | Borrower | Loan Amount |
|---|---|---|---|
| Open | Carte Brandon Michael | $280,250 | |
| Previous Owner | David A Grant | $78,000 | |
| Previous Owner | Karen Weaver | $113,050 |
Source: Public Records
Tax History Compared to Growth
Tax History
| Year | Tax Paid | Tax Assessment Tax Assessment Total Assessment is a certain percentage of the fair market value that is determined by local assessors to be the total taxable value of land and additions on the property. | Land | Improvement |
|---|---|---|---|---|
| 2024 | $4,557 | $101,540 | $24,500 | $77,040 |
| 2023 | $4,499 | $101,540 | $24,500 | $77,040 |
| 2022 | $4,192 | $80,820 | $33,710 | $47,110 |
| 2021 | $4,199 | $80,820 | $33,710 | $47,110 |
| 2020 | $4,205 | $80,820 | $33,710 | $47,110 |
| 2019 | $4,457 | $73,470 | $30,630 | $42,840 |
| 2018 | $3,756 | $73,470 | $30,630 | $42,840 |
| 2017 | $3,915 | $73,470 | $30,630 | $42,840 |
| 2016 | $3,376 | $50,960 | $9,450 | $41,510 |
| 2015 | $3,064 | $50,960 | $9,450 | $41,510 |
| 2014 | $3,072 | $50,960 | $9,450 | $41,510 |
| 2013 | $1,894 | $63,700 | $11,795 | $51,905 |
Source: Public Records
Map
Nearby Homes
- 93 King Ave Unit 95
- 1298 Hunter Ave
- 154-156 W 6th Ave
- 42 King Ave
- 63 Smith Place
- 1438-1440 Hunter Ave
- 6 1/2 Clark Place
- 59-59.5 W 5th Ave
- 1276 N High St Unit 206
- 1276 N High St Unit 402
- 49 Euclid Ave
- 1325 Indianola Ave Unit 325
- 1145 N High St Unit 203
- 1145 N High St Unit 307
- 30 W 4th Ave
- 18 W 4th Ave
- 126 E 6th Ave Unit 26
- 1404 Indianola Ave
- 343 King Ave Unit 345
- 1410 Indianola Ave
- 1320 Hunter Ave Unit 1320
- 106 W 6th Ave
- 112 W 6th Ave Unit 112
- 114 W 6th Ave
- 110 W 6th Ave
- 1328 Hunter Ave
- 1332 Hunter Ave
- 1310 Hunter Ave
- 107 W 6th Ave Unit 109
- 100 W 6th Ave
- 1338 Hunter Ave Unit 338
- 1302 Hunter Ave
- 101 W 6th Ave Unit 4
- 1340 Hunter Ave Unit 340
- 1319 Hunter Ave
- 1321 Dennison Ave
- 1315 Dennison Ave
- 1321 Hunter Ave
- 1321 Hunter Ave Unit C
- 1342 Hunter Ave Unit 342