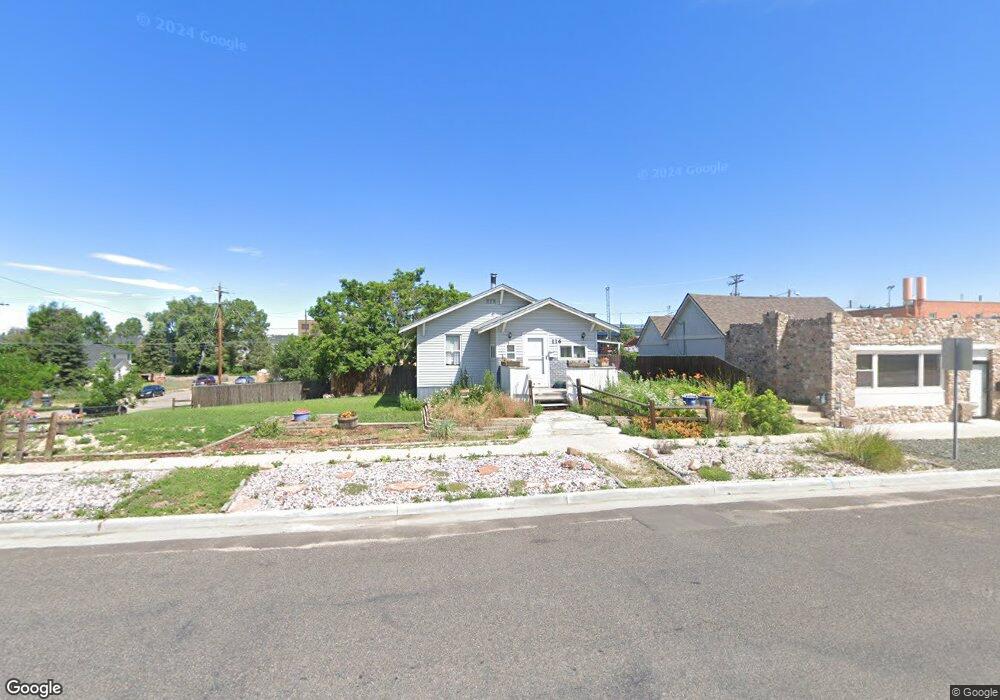
116 W 9th St Cheyenne, WY 82007
Historic Cheyenne NeighborhoodEstimated Value: $210,000 - $274,000
Studio
--
Bath
805
Sq Ft
$305/Sq Ft
Est. Value
About This Home
This home is located at 116 W 9th St, Cheyenne, WY 82007 and is currently estimated at $245,650, approximately $305 per square foot. 116 W 9th St is a home located in Laramie County with nearby schools including Cole Elementary School, Johnson Junior High School, and South High School.
Ownership History
Date
Name
Owned For
Owner Type
Purchase Details
Closed on
Apr 21, 2015
Sold by
Wright Richard J and Wright Heather R
Bought by
Paintbrush Homes Llc
Current Estimated Value
Home Financials for this Owner
Home Financials are based on the most recent Mortgage that was taken out on this home.
Original Mortgage
$80,000
Outstanding Balance
$61,809
Interest Rate
3.84%
Mortgage Type
Purchase Money Mortgage
Estimated Equity
$183,841
Purchase Details
Closed on
Apr 26, 2006
Sold by
Charley V Llc
Bought by
Wright Richard J and Wright Heather R
Home Financials for this Owner
Home Financials are based on the most recent Mortgage that was taken out on this home.
Original Mortgage
$89,000
Interest Rate
8.37%
Mortgage Type
Fannie Mae Freddie Mac
Purchase Details
Closed on
May 19, 2003
Sold by
Bank One Na
Bought by
Charley V Llc
Purchase Details
Closed on
Feb 21, 2003
Sold by
Hughes Tony C and Hughes Carmelita D
Bought by
Bank One Na
Purchase Details
Closed on
Oct 18, 2002
Sold by
Hughes Tony C and Hughes Carmelita D
Bought by
Bank One National Assn
Create a Home Valuation Report for This Property
The Home Valuation Report is an in-depth analysis detailing your home's value as well as a comparison with similar homes in the area
Home Values in the Area
Average Home Value in this Area
Purchase History
| Date | Buyer | Sale Price | Title Company |
|---|---|---|---|
| Paintbrush Homes Llc | -- | Summit Title Services | |
| Wright Richard J | -- | None Available | |
| Charley V Llc | -- | -- | |
| Bank One Na | $48,000 | -- | |
| Bank One National Assn | $33,750 | -- |
Source: Public Records
Mortgage History
| Date | Status | Borrower | Loan Amount |
|---|---|---|---|
| Open | Paintbrush Homes Llc | $80,000 | |
| Previous Owner | Wright Richard J | $89,000 |
Source: Public Records
Tax History
| Year | Tax Paid | Tax Assessment Tax Assessment Total Assessment is a certain percentage of the fair market value that is determined by local assessors to be the total taxable value of land and additions on the property. | Land | Improvement |
|---|---|---|---|---|
| 2025 | $1,570 | $17,005 | $3,618 | $13,387 |
| 2024 | $1,570 | $22,202 | $4,824 | $17,378 |
| 2023 | $1,523 | $21,534 | $4,824 | $16,710 |
| 2022 | $1,351 | $18,713 | $4,722 | $13,991 |
| 2021 | $1,247 | $17,238 | $4,722 | $12,516 |
| 2020 | $1,105 | $15,312 | $4,722 | $10,590 |
| 2019 | $1,042 | $14,433 | $4,722 | $9,711 |
| 2018 | $901 | $12,593 | $3,908 | $8,685 |
| 2017 | $835 | $11,567 | $2,958 | $8,609 |
| 2016 | $752 | $10,422 | $2,699 | $7,723 |
| 2015 | $738 | $10,224 | $2,699 | $7,525 |
| 2014 | -- | $10,140 | $2,732 | $7,408 |
Source: Public Records
Map
Nearby Homes
- 112 W 9th St
- 912 Capitol Ave
- 200 W 9th St
- 823 Capitol Ave
- 210 W 9th St
- 912 Central Ave
- 113 W 9th St Unit 3
- 113 W 9th St
- 201 W 10th St
- 212 W 9th St
- 215 W 10th St
- 910 Central Ave Unit 910
- 906 & 910 Central Ave
- 815 Capitol Ave
- 822 Capitol Ave
- 217 W 10th St
- 218 W 9th St
- 207 W 9th St
- 813 Capitol Ave
- 211 W 9th St
Your Personal Tour Guide
Ask me questions while you tour the home.