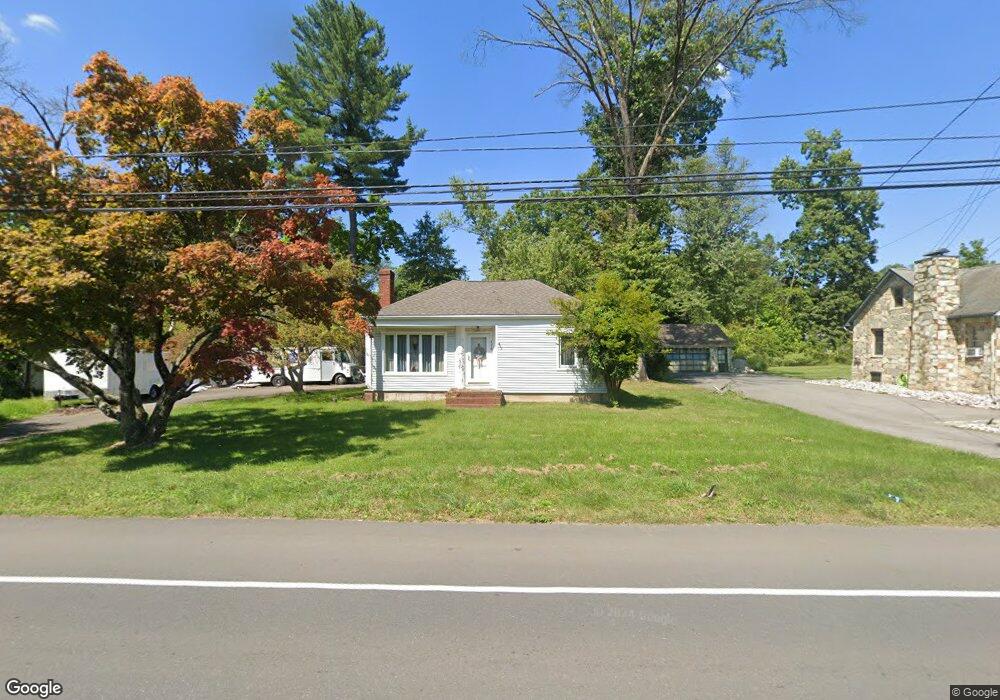
116 W Main St High Bridge, NJ 08829
Estimated Value: $302,645 - $397,000
--
Bed
--
Bath
1,298
Sq Ft
$263/Sq Ft
Est. Value
About This Home
This home is located at 116 W Main St, High Bridge, NJ 08829 and is currently estimated at $341,161, approximately $262 per square foot. 116 W Main St is a home located in Hunterdon County with nearby schools including High Bridge Elementary School, High Bridge Middle School, and Voorhees High School.
Ownership History
Date
Name
Owned For
Owner Type
Purchase Details
Closed on
Feb 15, 2002
Sold by
Becker Robert
Bought by
Brower Sandy
Current Estimated Value
Home Financials for this Owner
Home Financials are based on the most recent Mortgage that was taken out on this home.
Original Mortgage
$112,500
Outstanding Balance
$46,353
Interest Rate
7.01%
Estimated Equity
$294,808
Purchase Details
Closed on
Jul 2, 1993
Sold by
Longstreetest Of Viola S
Bought by
Becker Robert
Purchase Details
Closed on
Mar 4, 1991
Sold by
Smithedna M Of Est
Bought by
Longstreet Viola S
Create a Home Valuation Report for This Property
The Home Valuation Report is an in-depth analysis detailing your home's value as well as a comparison with similar homes in the area
Home Values in the Area
Average Home Value in this Area
Purchase History
| Date | Buyer | Sale Price | Title Company |
|---|---|---|---|
| Brower Sandy | $125,000 | -- | |
| Becker Robert | $101,500 | -- | |
| Longstreet Viola S | -- | -- |
Source: Public Records
Mortgage History
| Date | Status | Borrower | Loan Amount |
|---|---|---|---|
| Open | Brower Sandy | $112,500 |
Source: Public Records
Tax History Compared to Growth
Tax History
| Year | Tax Paid | Tax Assessment Tax Assessment Total Assessment is a certain percentage of the fair market value that is determined by local assessors to be the total taxable value of land and additions on the property. | Land | Improvement |
|---|---|---|---|---|
| 2025 | $7,240 | $263,300 | $139,400 | $123,900 |
| 2024 | $6,651 | $221,800 | $66,600 | $155,200 |
| 2023 | $6,651 | $168,200 | $61,200 | $107,000 |
| 2022 | $7,157 | $168,200 | $61,200 | $107,000 |
| 2021 | $6,928 | $167,700 | $61,200 | $106,500 |
| 2020 | $6,876 | $167,700 | $61,200 | $106,500 |
| 2019 | $6,928 | $167,700 | $61,200 | $106,500 |
| 2018 | $6,646 | $167,700 | $61,200 | $106,500 |
| 2017 | $6,987 | $181,300 | $74,800 | $106,500 |
| 2016 | $6,906 | $181,300 | $74,800 | $106,500 |
| 2015 | $6,719 | $181,300 | $74,800 | $106,500 |
| 2014 | $8,195 | $239,000 | $139,000 | $100,000 |
Source: Public Records
Map
Nearby Homes