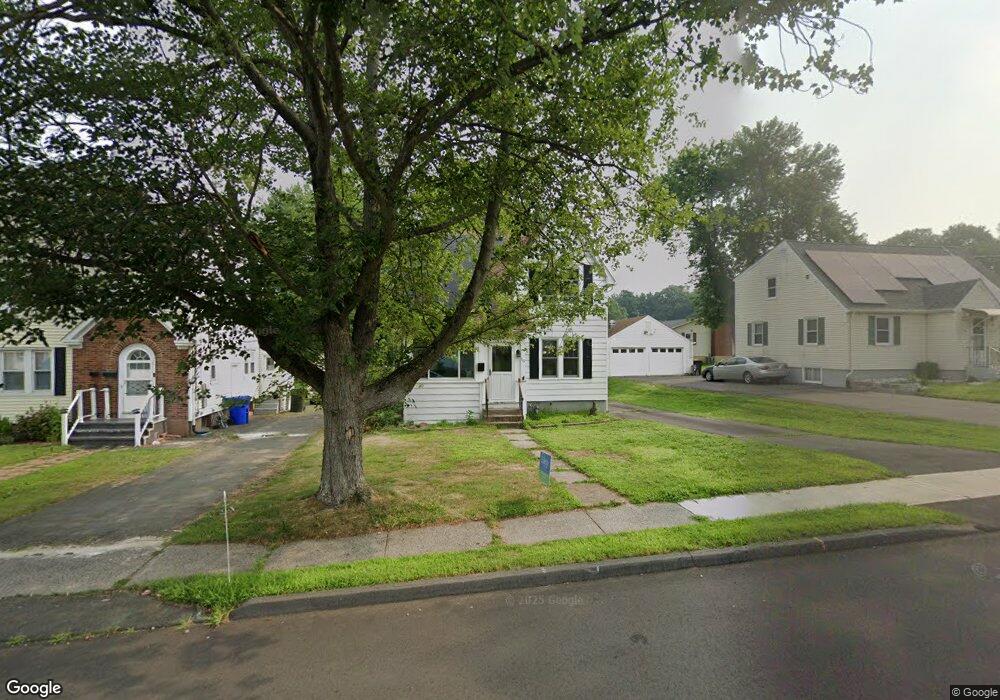
116 Walnut St East Hartford, CT 06108
Estimated Value: $264,000 - $283,000
2
Beds
2
Baths
1,211
Sq Ft
$226/Sq Ft
Est. Value
About This Home
This home is located at 116 Walnut St, East Hartford, CT 06108 and is currently estimated at $273,879, approximately $226 per square foot. 116 Walnut St is a home located in Hartford County with nearby schools including Dr. Franklin H. Mayberry School, East Hartford Middle School, and East Hartford High School.
Ownership History
Date
Name
Owned For
Owner Type
Purchase Details
Closed on
May 12, 2017
Sold by
Plomell Pamela A
Bought by
Greene Robert J
Current Estimated Value
Purchase Details
Closed on
Feb 7, 2002
Sold by
Ergle Alan D and Ergle Janis N
Bought by
Plonell Pamela A
Home Financials for this Owner
Home Financials are based on the most recent Mortgage that was taken out on this home.
Original Mortgage
$94,500
Interest Rate
5.75%
Create a Home Valuation Report for This Property
The Home Valuation Report is an in-depth analysis detailing your home's value as well as a comparison with similar homes in the area
Home Values in the Area
Average Home Value in this Area
Purchase History
| Date | Buyer | Sale Price | Title Company |
|---|---|---|---|
| Greene Robert J | -- | -- | |
| Plonell Pamela A | $105,000 | -- |
Source: Public Records
Mortgage History
| Date | Status | Borrower | Loan Amount |
|---|---|---|---|
| Previous Owner | Plonell Pamela A | $89,790 | |
| Previous Owner | Plonell Pamela A | $94,500 | |
| Previous Owner | Plonell Pamela A | $72,500 |
Source: Public Records
Tax History Compared to Growth
Tax History
| Year | Tax Paid | Tax Assessment Tax Assessment Total Assessment is a certain percentage of the fair market value that is determined by local assessors to be the total taxable value of land and additions on the property. | Land | Improvement |
|---|---|---|---|---|
| 2025 | $5,459 | $118,930 | $37,070 | $81,860 |
| 2024 | $5,233 | $118,930 | $37,070 | $81,860 |
| 2023 | $5,059 | $118,930 | $37,070 | $81,860 |
| 2022 | $4,876 | $118,930 | $37,070 | $81,860 |
| 2021 | $4,279 | $86,710 | $28,080 | $58,630 |
| 2020 | $4,329 | $86,710 | $28,080 | $58,630 |
| 2019 | $4,258 | $86,710 | $28,080 | $58,630 |
| 2018 | $4,133 | $86,710 | $28,080 | $58,630 |
| 2017 | $4,080 | $86,710 | $28,080 | $58,630 |
| 2016 | $3,948 | $86,080 | $28,080 | $58,000 |
| 2015 | $3,948 | $86,080 | $28,080 | $58,000 |
| 2014 | $3,908 | $86,080 | $28,080 | $58,000 |
Source: Public Records
Map
Nearby Homes
- 53 Arbutus St
- 15 Christine Dr
- 1220 Burnside Ave Unit A
- 95 Arnold Dr
- 13-15 Burnside Ave
- 90 Christine Dr
- 207 Arnold Dr
- 47 Bodwell Rd
- 0 Hillside Ave
- 1166 Middle Turnpike W Unit B1
- 952 Tolland St
- 26 Casabella Cir Unit 28
- 8 Howard Ct Unit 10
- 127 Ridgewood Rd
- 61 Leverich Dr
- 73 Bliss St
- 40 Larrabee St
- 59 Laraia Ave
- 1555 Tolland Turnpike
- 4 Gladys Rd