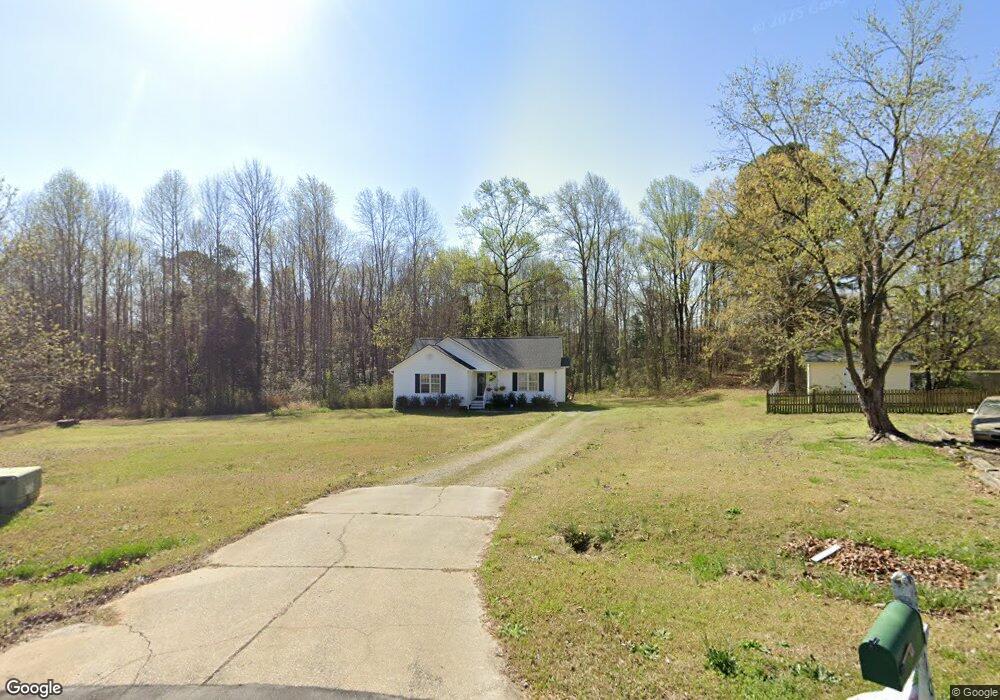
116 White Falls Cir Unit 1 Benson, NC 27504
Pleasant Grove NeighborhoodEstimated Value: $282,000 - $317,000
3
Beds
2
Baths
1,210
Sq Ft
$251/Sq Ft
Est. Value
About This Home
This home is located at 116 White Falls Cir Unit 1, Benson, NC 27504 and is currently estimated at $303,886, approximately $251 per square foot. 116 White Falls Cir Unit 1 is a home located in Johnston County with nearby schools including McGee's Crossroads Elementary School, McGee's Crossroads Middle School, and West Johnston High School.
Ownership History
Date
Name
Owned For
Owner Type
Purchase Details
Closed on
Nov 20, 2020
Sold by
Capps Development Llc
Bought by
Boho Abdellatif and Aberrane Zainab
Current Estimated Value
Home Financials for this Owner
Home Financials are based on the most recent Mortgage that was taken out on this home.
Original Mortgage
$201,286
Outstanding Balance
$179,116
Interest Rate
2.8%
Mortgage Type
FHA
Estimated Equity
$124,770
Purchase Details
Closed on
Jun 30, 2016
Sold by
Stuart St John and Forero Sally
Bought by
Capps Development Llc
Purchase Details
Closed on
May 16, 2005
Sold by
Johnson Adam Buck and Johnson Rebekah S
Bought by
Stuart St John
Home Financials for this Owner
Home Financials are based on the most recent Mortgage that was taken out on this home.
Original Mortgage
$91,100
Interest Rate
7.2%
Mortgage Type
Adjustable Rate Mortgage/ARM
Create a Home Valuation Report for This Property
The Home Valuation Report is an in-depth analysis detailing your home's value as well as a comparison with similar homes in the area
Home Values in the Area
Average Home Value in this Area
Purchase History
| Date | Buyer | Sale Price | Title Company |
|---|---|---|---|
| Boho Abdellatif | $205,000 | None Available | |
| Capps Development Llc | $136,000 | None Available | |
| Stuart St John | $114,000 | None Available |
Source: Public Records
Mortgage History
| Date | Status | Borrower | Loan Amount |
|---|---|---|---|
| Open | Boho Abdellatif | $201,286 | |
| Previous Owner | Stuart St John | $91,100 |
Source: Public Records
Tax History Compared to Growth
Tax History
| Year | Tax Paid | Tax Assessment Tax Assessment Total Assessment is a certain percentage of the fair market value that is determined by local assessors to be the total taxable value of land and additions on the property. | Land | Improvement |
|---|---|---|---|---|
| 2025 | $2,056 | $323,840 | $106,250 | $217,590 |
| 2024 | $1,370 | $169,170 | $55,000 | $114,170 |
| 2023 | $1,328 | $169,170 | $55,000 | $114,170 |
| 2022 | $1,370 | $169,170 | $55,000 | $114,170 |
| 2021 | $1,370 | $169,170 | $55,000 | $114,170 |
| 2020 | $1,421 | $169,170 | $55,000 | $114,170 |
| 2019 | $1,387 | $169,170 | $55,000 | $114,170 |
| 2018 | $963 | $114,610 | $34,380 | $80,230 |
| 2017 | $963 | $114,610 | $34,380 | $80,230 |
| 2016 | $963 | $114,610 | $34,380 | $80,230 |
| 2015 | $977 | $114,610 | $34,380 | $80,230 |
| 2014 | $977 | $114,610 | $34,380 | $80,230 |
Source: Public Records
Map
Nearby Homes
- 216 Deep Pool Ct
- 121 Wilmack Dr
- 125 Bay Meadow Ln
- 926 Lazy Branch Dr
- 1190 Sanders Rd
- 400 Rose Ct
- 300 Still Meadows Ct
- 358 Coats Ridge Dr
- 142 Hot Springs Way
- 160 Hot Springs Way
- 180 Hot Springs Way
- 208 Hunting Lodge Rd
- 381 Gray Ghost St
- 93 Hot Springs Way
- 111 Hot Springs Way
- 687 W Watson Rd
- 268 Busterfield Ct
- 309 Busterfield Ct
- 182 Pleasant Ridge Ct
- 62 Pelt Place
- 116 White Falls Cir
- 108 White Falls Cir
- 115 White Falls Cir
- 106 White Falls Cir
- 104 White Falls Cir
- 109 White Falls Cir
- 105 White Falls Cir
- 412 Lazy Branch Dr
- 100 White Falls Cir
- 151 Creekstone Dr
- 408 Lazy Branch Dr
- 149 Creekstone Dr
- 157 Creekstone Dr
- 147 Creekstone Dr
- 104 Rope Swing Cir
- 108 Rope Swing Cir
- 404 Lazy Branch Dr
- 513 Lazy Branch Dr
- 139 Creekstone Dr
- 100 Rope Swing Cir