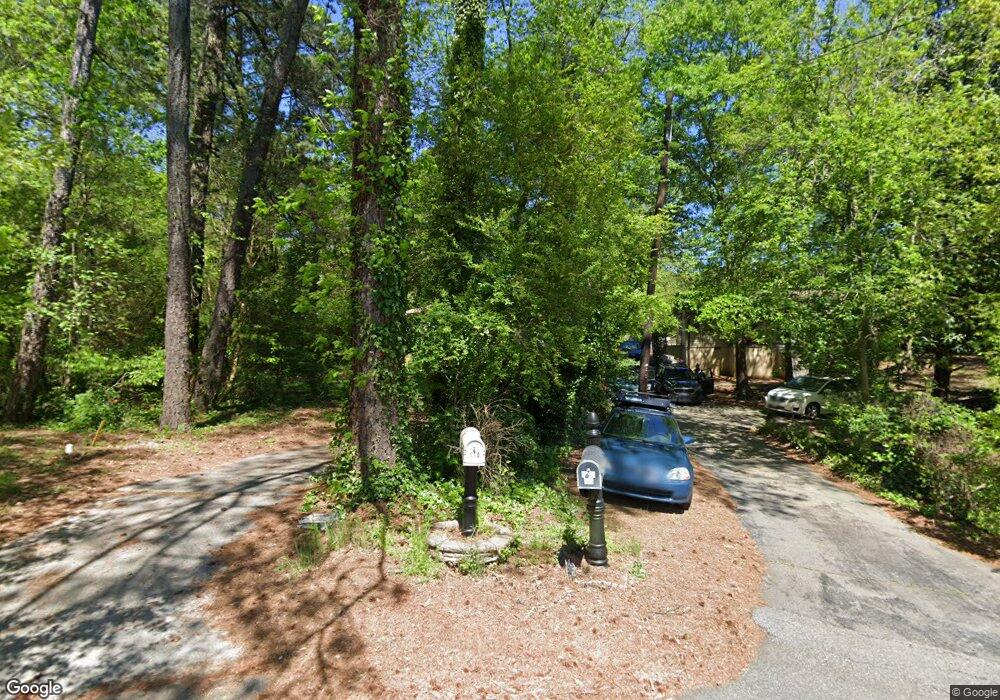
116 Woodland Ct Atlanta, GA 30340
Estimated Value: $219,000 - $315,000
3
Beds
1
Bath
1,200
Sq Ft
$230/Sq Ft
Est. Value
About This Home
This home is located at 116 Woodland Ct, Atlanta, GA 30340 and is currently estimated at $276,301, approximately $230 per square foot. 116 Woodland Ct is a home located in Gwinnett County with nearby schools including Baldwin Elementary, Summerour Middle School, and Paul Duke STEM High School.
Ownership History
Date
Name
Owned For
Owner Type
Purchase Details
Closed on
Nov 20, 2006
Sold by
Robbins Harold L
Bought by
Briley Craig K and Briley Heidi
Current Estimated Value
Home Financials for this Owner
Home Financials are based on the most recent Mortgage that was taken out on this home.
Original Mortgage
$15,800
Outstanding Balance
$9,446
Interest Rate
6.31%
Mortgage Type
Unknown
Estimated Equity
$266,855
Purchase Details
Closed on
Nov 16, 1998
Sold by
Maltbie Mary E
Bought by
Robbins Harold L
Home Financials for this Owner
Home Financials are based on the most recent Mortgage that was taken out on this home.
Original Mortgage
$74,350
Interest Rate
6.84%
Mortgage Type
FHA
Create a Home Valuation Report for This Property
The Home Valuation Report is an in-depth analysis detailing your home's value as well as a comparison with similar homes in the area
Home Values in the Area
Average Home Value in this Area
Purchase History
| Date | Buyer | Sale Price | Title Company |
|---|---|---|---|
| Briley Craig K | $105,500 | -- | |
| Robbins Harold L | $75,000 | -- |
Source: Public Records
Mortgage History
| Date | Status | Borrower | Loan Amount |
|---|---|---|---|
| Open | Briley Craig K | $15,800 | |
| Open | Briley Craig K | $79,100 | |
| Previous Owner | Robbins Harold L | $74,350 |
Source: Public Records
Tax History Compared to Growth
Tax History
| Year | Tax Paid | Tax Assessment Tax Assessment Total Assessment is a certain percentage of the fair market value that is determined by local assessors to be the total taxable value of land and additions on the property. | Land | Improvement |
|---|---|---|---|---|
| 2024 | $2,278 | $54,080 | $16,800 | $37,280 |
| 2023 | $2,278 | $54,080 | $16,800 | $37,280 |
| 2022 | $1,622 | $54,080 | $16,800 | $37,280 |
| 2021 | $1,632 | $37,000 | $12,000 | $25,000 |
| 2020 | $1,638 | $37,000 | $12,000 | $25,000 |
| 2019 | $1,516 | $35,040 | $8,000 | $27,040 |
| 2018 | $1,510 | $35,040 | $8,000 | $27,040 |
| 2016 | $1,145 | $24,080 | $8,000 | $16,080 |
| 2015 | $767 | $13,080 | $8,000 | $5,080 |
| 2014 | $770 | $13,080 | $8,000 | $5,080 |
Source: Public Records
Map
Nearby Homes