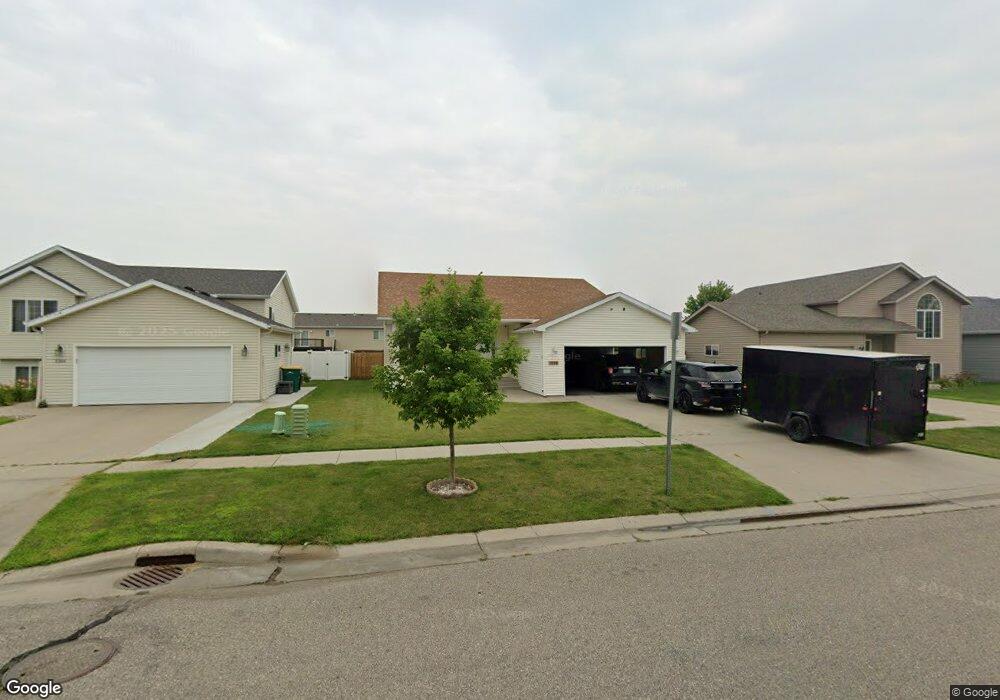
1160 39 1 2 Ave W West Fargo, ND 58078
Eagle Run NeighborhoodEstimated Value: $305,000 - $337,000
2
Beds
2
Baths
2,444
Sq Ft
$132/Sq Ft
Est. Value
About This Home
This home is located at 1160 39 1 2 Ave W, West Fargo, ND 58078 and is currently estimated at $322,753, approximately $132 per square foot. 1160 39 1 2 Ave W is a home located in Cass County with nearby schools including Aurora Elementary School, Liberty Middle School, and West Fargo Sheyenne High School.
Ownership History
Date
Name
Owned For
Owner Type
Purchase Details
Closed on
Jun 27, 2025
Sold by
Hesby Alexander W and Hesby Makayla
Bought by
Christian Allison
Current Estimated Value
Home Financials for this Owner
Home Financials are based on the most recent Mortgage that was taken out on this home.
Original Mortgage
$267,323
Outstanding Balance
$266,867
Interest Rate
6.81%
Mortgage Type
New Conventional
Estimated Equity
$55,886
Purchase Details
Closed on
May 1, 2017
Sold by
Rodgers Katherine Arlette
Bought by
Hesby Alexander W
Home Financials for this Owner
Home Financials are based on the most recent Mortgage that was taken out on this home.
Original Mortgage
$204,250
Interest Rate
4.23%
Mortgage Type
New Conventional
Purchase Details
Closed on
Jan 21, 2008
Sold by
Loerzel Bruce M and Loerzel Allison C
Bought by
Rodgers Katherine Arlette
Home Financials for this Owner
Home Financials are based on the most recent Mortgage that was taken out on this home.
Original Mortgage
$50,000
Interest Rate
5.95%
Mortgage Type
New Conventional
Create a Home Valuation Report for This Property
The Home Valuation Report is an in-depth analysis detailing your home's value as well as a comparison with similar homes in the area
Home Values in the Area
Average Home Value in this Area
Purchase History
| Date | Buyer | Sale Price | Title Company |
|---|---|---|---|
| Christian Allison | $290,000 | Fm Title | |
| Hesby Alexander W | $215,000 | Title Co | |
| Rodgers Katherine Arlette | -- | -- |
Source: Public Records
Mortgage History
| Date | Status | Borrower | Loan Amount |
|---|---|---|---|
| Open | Christian Allison | $267,323 | |
| Previous Owner | Hesby Alexander W | $204,250 | |
| Previous Owner | Rodgers Katherine Arlette | $50,000 |
Source: Public Records
Tax History Compared to Growth
Tax History
| Year | Tax Paid | Tax Assessment Tax Assessment Total Assessment is a certain percentage of the fair market value that is determined by local assessors to be the total taxable value of land and additions on the property. | Land | Improvement |
|---|---|---|---|---|
| 2024 | $3,588 | $143,500 | $21,150 | $122,350 |
| 2023 | $3,935 | $137,550 | $21,150 | $116,400 |
| 2022 | $3,663 | $126,300 | $21,150 | $105,150 |
| 2021 | $3,442 | $118,150 | $16,950 | $101,200 |
| 2020 | $3,221 | $112,400 | $16,950 | $95,450 |
| 2019 | $3,173 | $109,650 | $16,950 | $92,700 |
| 2018 | $2,957 | $105,700 | $16,950 | $88,750 |
| 2017 | $2,841 | $106,650 | $16,950 | $89,700 |
| 2016 | $4,085 | $104,500 | $16,950 | $87,550 |
| 2015 | $3,890 | $88,500 | $8,850 | $79,650 |
| 2014 | $3,918 | $82,700 | $8,850 | $73,850 |
| 2013 | $3,861 | $78,500 | $8,850 | $69,650 |
Source: Public Records
Map
Nearby Homes
- 1040 39th Ave W
- 909 38 1 2 Ave W
- 1156 42nd Ave W Unit A
- 1054 42nd Ave W
- 1236 S Beach Way
- 1168 43rd Ave W
- 1381 Westport Beach Way
- 3662 N Sedona Ct
- 4509 11th St W
- 4507 Newport Ln
- 4534 Westport Pkwy
- 4717 11th St W
- 4757 11th St W
- 1097 Hickory Ln
- 1089 Hickory Ln
- 1082 Larkin Ln
- 1052 50th Ave W
- 974 50th Ave W
- 945 31st Ave W
- 911 50th Ave W
- 1160 39 1/2 Ave W
- 1166 39 1 2 Ave W
- 1166 39 1/2 Ave W
- 1154 39 1/2 Ave W
- 1154 39 1 2 Ave W
- 1172 39 1/2 Ave W
- 1172 39 1 2 Ave W
- 1148 39 1 2 Ave W
- 1055 39th Ave W
- 1148 39 1/2 Ave W
- 1049 39th Ave W
- 1103 39th Ave W
- 1178 39 1/2 Ave W
- 1178 39 1 2 Ave W
- 1043 39th Ave W
- 1142 39 1 2 Ave W
- 1109 39th Ave W
- 1142 39 1/2 Ave W
- 1159 39 1 2 Ave W
- 1165 39 1 2 Ave W