Estimated Value: $1,095,380 - $1,277,000
3
Beds
2
Baths
1,976
Sq Ft
$588/Sq Ft
Est. Value
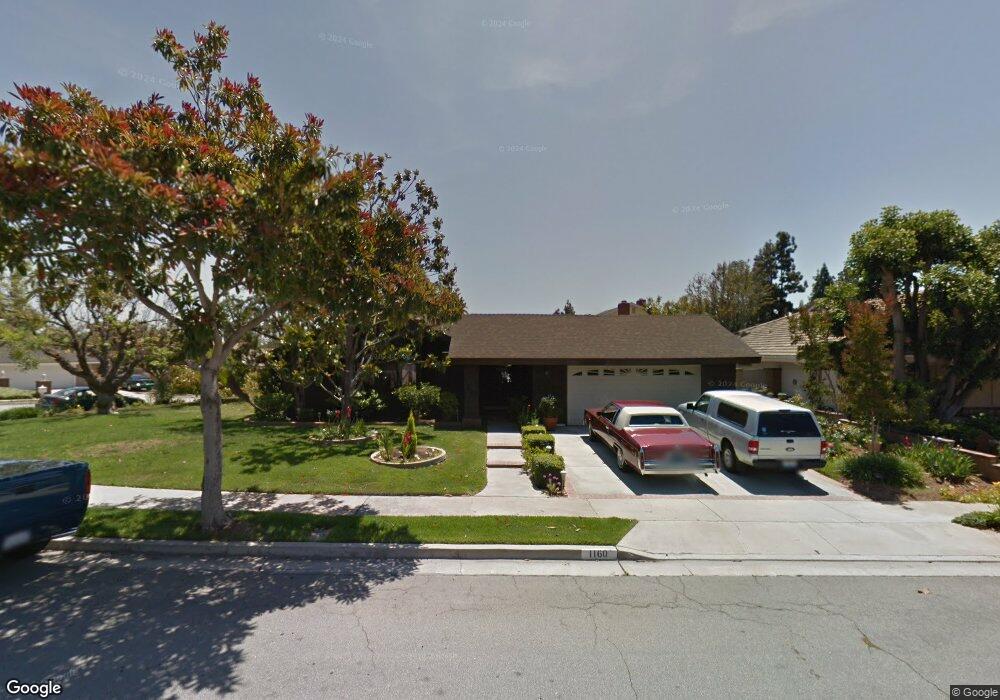
About This Home
This home is located at 1160 Alta Mesa Dr, Brea, CA 92821 and is currently estimated at $1,162,595, approximately $588 per square foot. 1160 Alta Mesa Dr is a home located in Orange County with nearby schools including Mariposa Elementary School, Brea Junior High School, and Brea-Olinda High School.
Ownership History
Date
Name
Owned For
Owner Type
Purchase Details
Closed on
Sep 12, 2008
Sold by
Blue Timothy P and Blue Cyrilla N
Bought by
Blue Timothy P and Blue Cyrilla N
Current Estimated Value
Purchase Details
Closed on
Sep 10, 1997
Sold by
Blue Timothy P and Blue Cyrilla N
Bought by
Blue Timothy P and Blue Cyrilla N
Create a Home Valuation Report for This Property
The Home Valuation Report is an in-depth analysis detailing your home's value as well as a comparison with similar homes in the area
Home Values in the Area
Average Home Value in this Area
Purchase History
| Date | Buyer | Sale Price | Title Company |
|---|---|---|---|
| Blue Timothy P | -- | None Available | |
| Blue Timothy P | -- | -- |
Source: Public Records
Tax History
| Year | Tax Paid | Tax Assessment Tax Assessment Total Assessment is a certain percentage of the fair market value that is determined by local assessors to be the total taxable value of land and additions on the property. | Land | Improvement |
|---|---|---|---|---|
| 2025 | $2,022 | $151,744 | $57,612 | $94,132 |
| 2024 | $2,022 | $148,769 | $56,482 | $92,287 |
| 2023 | $1,965 | $145,852 | $55,374 | $90,478 |
| 2022 | $1,941 | $142,993 | $54,289 | $88,704 |
| 2021 | $1,906 | $140,190 | $53,225 | $86,965 |
| 2020 | $1,892 | $138,753 | $52,679 | $86,074 |
| 2019 | $1,849 | $136,033 | $51,646 | $84,387 |
| 2018 | $1,822 | $133,366 | $50,633 | $82,733 |
| 2017 | $1,789 | $130,751 | $49,640 | $81,111 |
| 2016 | $1,679 | $128,188 | $48,667 | $79,521 |
| 2015 | $1,654 | $126,263 | $47,936 | $78,327 |
| 2014 | $1,607 | $123,790 | $46,997 | $76,793 |
Source: Public Records
Map
Nearby Homes
- 1400 N Puente St
- 1308 Las Lomas Dr
- 1319 Las Lomas Dr
- 1209 N Puente St
- 1001 W Dorothy Dr
- 1215 Wardman Dr
- 1060 Tropicana Way
- 912 Bonnie Way
- 1013 Woodcrest Ave
- 18216 Midbury St
- 450 Palermo Way
- 958 Baxter Pkwy
- 1051 Site Dr Unit 197
- 1051 Site Dr Unit 236
- 1051 Site Dr Unit 281
- 1051 Site Dr Unit 255
- 1051 Site Dr Unit 38
- 1051 Site Dr Unit 25
- 1051 Site Dr Unit 26
- 1051 Site Dr Unit 251
- 1435 Alta Mesa Way Unit B
- 1435 Alta Mesa Way
- 1168 Alta Mesa Dr
- 1436 Alta Mesa Way
- 1159 Alta Mesa Dr
- 1426 Alta Mesa Way
- 1425 Alta Mesa Way
- 1169 Alta Mesa Dr
- 1149 Alta Mesa Dr
- 1446 Alta Mesa Way
- 1179 W Alta Mesa Dr
- 1179 Alta Mesa Dr
- 1420 Alta Mesa Way
- 1456 Alta Mesa Way
- 1448 N Puente St
- 1189 Alta Mesa Dr
- 1438 N Puente St
- 1070 Northwood Ave
- 1107 W Dorothy Dr
- 1050 Northwood Ave
Your Personal Tour Guide
Ask me questions while you tour the home.