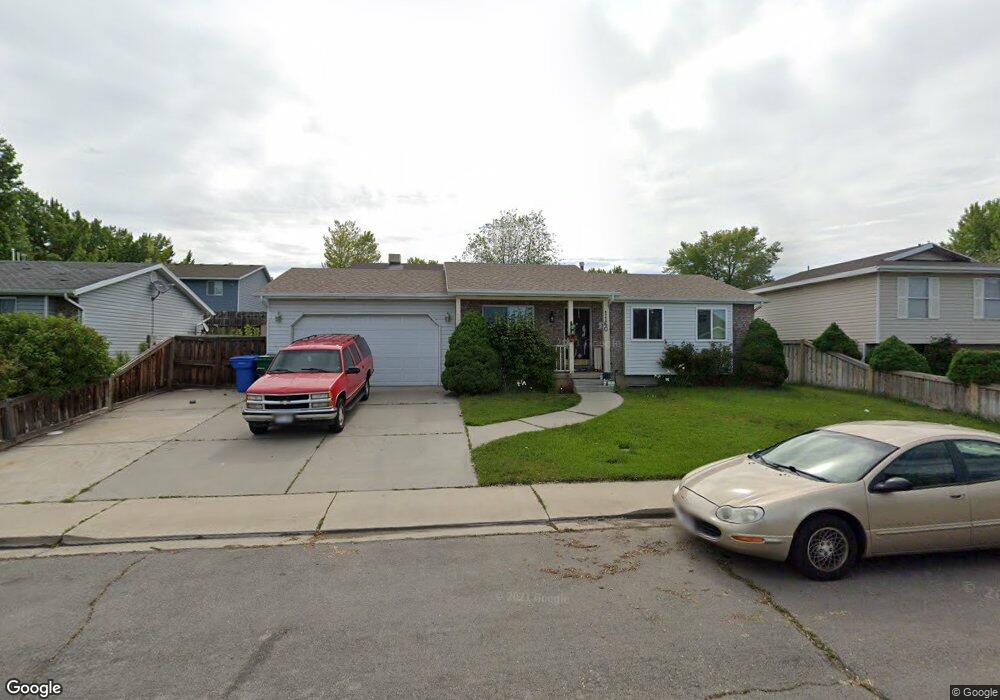
1160 N 1165 W Orem, UT 84057
Bonneville NeighborhoodEstimated Value: $455,000 - $502,000
3
Beds
1
Bath
1,957
Sq Ft
$242/Sq Ft
Est. Value
About This Home
This home is located at 1160 N 1165 W, Orem, UT 84057 and is currently estimated at $474,176, approximately $242 per square foot. 1160 N 1165 W is a home located in Utah County with nearby schools including Bonneville Elementary School, Orem Junior High School, and Timpanogos High School.
Ownership History
Date
Name
Owned For
Owner Type
Purchase Details
Closed on
Dec 20, 2021
Sold by
Jorge Solis
Bought by
Chacon Jorge Solis
Current Estimated Value
Home Financials for this Owner
Home Financials are based on the most recent Mortgage that was taken out on this home.
Original Mortgage
$177,000
Outstanding Balance
$162,508
Interest Rate
2.98%
Mortgage Type
New Conventional
Estimated Equity
$311,668
Purchase Details
Closed on
Apr 30, 2008
Sold by
Ramos Rafael
Bought by
Solis Jorge
Purchase Details
Closed on
Aug 11, 2006
Sold by
Winder Wendy L
Bought by
Solis Jorge and Ramos Rafael
Home Financials for this Owner
Home Financials are based on the most recent Mortgage that was taken out on this home.
Original Mortgage
$213,000
Interest Rate
6.76%
Mortgage Type
Purchase Money Mortgage
Create a Home Valuation Report for This Property
The Home Valuation Report is an in-depth analysis detailing your home's value as well as a comparison with similar homes in the area
Home Values in the Area
Average Home Value in this Area
Purchase History
| Date | Buyer | Sale Price | Title Company |
|---|---|---|---|
| Chacon Jorge Solis | -- | Monument Title | |
| Solis Jorge | -- | None Available | |
| Solis Jorge | -- | Equity Title Orem Blvd |
Source: Public Records
Mortgage History
| Date | Status | Borrower | Loan Amount |
|---|---|---|---|
| Open | Chacon Jorge Solis | $177,000 | |
| Previous Owner | Solis Jorge | $213,000 |
Source: Public Records
Tax History Compared to Growth
Tax History
| Year | Tax Paid | Tax Assessment Tax Assessment Total Assessment is a certain percentage of the fair market value that is determined by local assessors to be the total taxable value of land and additions on the property. | Land | Improvement |
|---|---|---|---|---|
| 2025 | $1,738 | $223,850 | $183,600 | $223,400 |
| 2024 | $1,738 | $212,520 | $0 | $0 |
| 2023 | $1,645 | $216,205 | $0 | $0 |
| 2022 | $1,696 | $215,930 | $0 | $0 |
| 2021 | $1,579 | $304,500 | $143,400 | $161,100 |
| 2020 | $1,438 | $272,600 | $114,700 | $157,900 |
| 2019 | $1,322 | $260,500 | $114,700 | $145,800 |
| 2018 | $1,280 | $241,100 | $104,900 | $136,200 |
| 2017 | $1,181 | $119,185 | $0 | $0 |
| 2016 | $1,243 | $115,665 | $0 | $0 |
| 2015 | $1,178 | $103,620 | $0 | $0 |
| 2014 | $1,136 | $99,495 | $0 | $0 |
Source: Public Records
Map
Nearby Homes
- 1026 N 1090 W Unit 404
- 1081 W 993 N Unit 101
- 1081 W 993 N Unit 202
- 999 W 1100 N
- 1015 N 995 W
- 983 W 1055 N Unit 816
- 1030 N 995 W Unit 915
- 1140 W 950 N Unit D304
- 1335 N 1230 W
- 982 W 960 N Unit 109
- 1175 W 1420 N
- 875 W 1130 N
- 930 N 980 W
- 1426 N 1300 W Unit 63
- 933 N 900 W
- 1279 W 1480 N
- 1496 N 1285 W
- 1503 N 1285 W
- 947 N 830 W
- 1512 N 1335 W