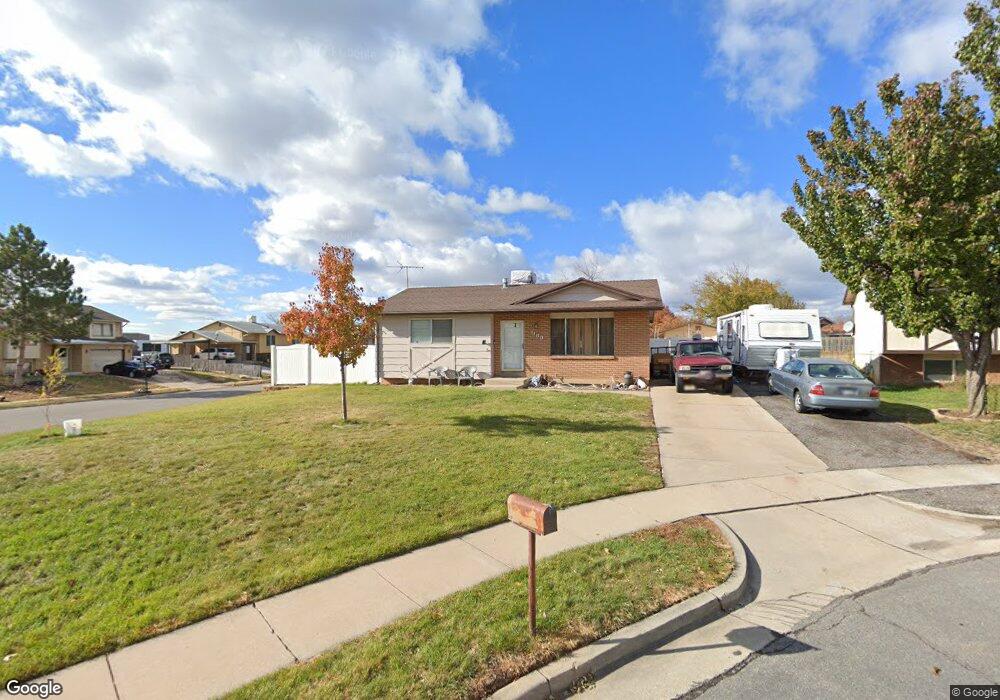
1160 N 1500 W Layton, UT 84041
Estimated Value: $398,000 - $427,955
4
Beds
2
Baths
1,922
Sq Ft
$214/Sq Ft
Est. Value
About This Home
This home is located at 1160 N 1500 W, Layton, UT 84041 and is currently estimated at $411,239, approximately $213 per square foot. 1160 N 1500 W is a home located in Davis County with nearby schools including Central Davis Junior High School, Layton High School, and North Davis Preparatory Academy.
Ownership History
Date
Name
Owned For
Owner Type
Purchase Details
Closed on
Oct 2, 2017
Sold by
Johnston Charles R and Johnston Heather
Bought by
Clark Robert
Current Estimated Value
Home Financials for this Owner
Home Financials are based on the most recent Mortgage that was taken out on this home.
Original Mortgage
$194,000
Outstanding Balance
$161,654
Interest Rate
3.82%
Mortgage Type
VA
Estimated Equity
$249,585
Purchase Details
Closed on
Sep 27, 2001
Sold by
Johnston Charles R
Bought by
Johnston Charles R and Johnston Heather
Home Financials for this Owner
Home Financials are based on the most recent Mortgage that was taken out on this home.
Original Mortgage
$71,050
Interest Rate
6.91%
Mortgage Type
FHA
Purchase Details
Closed on
Sep 26, 2001
Sold by
Fleming Chad E and Fleming Jill L
Bought by
Johnston Charles R
Home Financials for this Owner
Home Financials are based on the most recent Mortgage that was taken out on this home.
Original Mortgage
$71,050
Interest Rate
6.91%
Mortgage Type
FHA
Create a Home Valuation Report for This Property
The Home Valuation Report is an in-depth analysis detailing your home's value as well as a comparison with similar homes in the area
Home Values in the Area
Average Home Value in this Area
Purchase History
| Date | Buyer | Sale Price | Title Company |
|---|---|---|---|
| Clark Robert | -- | Metro National Title | |
| Johnston Charles R | -- | Equity Title Agency | |
| Johnston Charles R | -- | Mountain View Title & Escrow |
Source: Public Records
Mortgage History
| Date | Status | Borrower | Loan Amount |
|---|---|---|---|
| Open | Clark Robert | $194,000 | |
| Previous Owner | Johnston Charles R | $71,050 |
Source: Public Records
Tax History Compared to Growth
Tax History
| Year | Tax Paid | Tax Assessment Tax Assessment Total Assessment is a certain percentage of the fair market value that is determined by local assessors to be the total taxable value of land and additions on the property. | Land | Improvement |
|---|---|---|---|---|
| 2025 | -- | $198,000 | $106,963 | $91,037 |
| 2024 | -- | $194,700 | $127,527 | $67,173 |
| 2023 | -- | $335,000 | $160,502 | $174,498 |
| 2022 | $1,232 | $196,900 | $80,639 | $116,261 |
| 2021 | $1,232 | $262,000 | $116,767 | $145,233 |
| 2020 | $1,232 | $222,000 | $87,108 | $134,892 |
| 2019 | $1,232 | $214,000 | $83,760 | $130,240 |
| 2018 | $0 | $186,000 | $77,556 | $108,444 |
| 2016 | $1,179 | $86,570 | $21,754 | $64,816 |
| 2015 | $1,136 | $79,200 | $21,754 | $57,446 |
| 2014 | $1,071 | $76,334 | $21,754 | $54,580 |
| 2013 | -- | $73,867 | $20,680 | $53,187 |
Source: Public Records
Map
Nearby Homes
- 1133 Laytona Dr
- Fremont Plan at Trailside
- Blakely Plan at Trailside
- Arlington Plan at Trailside
- Savannah Plan at Trailside
- Charlotte Plan at Trailside
- Birmingham Plan at Trailside
- Oakridge Plan at Trailside
- Middleton Plan at Trailside
- Wilmington Plan at Trailside
- 1211 N 1875 W Unit 211
- 1211 N 1875 W
- 1219 N 1875 W
- 1219 N 1875 W Unit 212
- 1523 Sherma Ave
- 1493 Marilyn Dr
- 1254 Marilyn Dr
- 1259 W 1050 N
- 979 Cold Creek Way
- 1456 Scott Cir