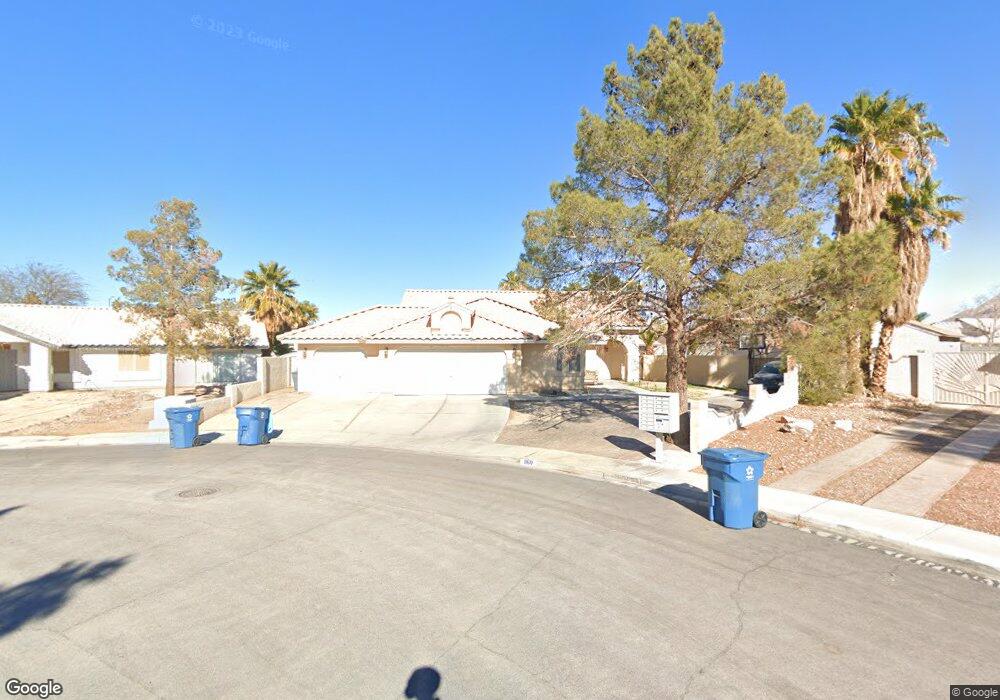
1160 Red Iron Way Las Vegas, NV 89110
Estimated Value: $446,000 - $475,000
4
Beds
2
Baths
1,789
Sq Ft
$258/Sq Ft
Est. Value
About This Home
This home is located at 1160 Red Iron Way, Las Vegas, NV 89110 and is currently estimated at $461,732, approximately $258 per square foot. 1160 Red Iron Way is a home located in Clark County with nearby schools including Stanford Elementary School, Duane D. Keller Middle School, and Eldorado High School.
Ownership History
Date
Name
Owned For
Owner Type
Purchase Details
Closed on
Mar 4, 2003
Sold by
Crooks Brentt and Crooks Lisa
Bought by
Cuevas Jose R and Cuevas Nora E
Current Estimated Value
Home Financials for this Owner
Home Financials are based on the most recent Mortgage that was taken out on this home.
Original Mortgage
$170,910
Outstanding Balance
$72,991
Interest Rate
5.79%
Estimated Equity
$388,741
Purchase Details
Closed on
Jan 27, 1994
Sold by
Rhodes Design & Development
Bought by
Crooks Brentt and Crooks Lisa
Home Financials for this Owner
Home Financials are based on the most recent Mortgage that was taken out on this home.
Original Mortgage
$118,702
Interest Rate
7.21%
Purchase Details
Closed on
Dec 16, 1993
Sold by
Sugarman Joseph and Sugarman Wendy C
Bought by
Rhodes Design & Development
Home Financials for this Owner
Home Financials are based on the most recent Mortgage that was taken out on this home.
Original Mortgage
$118,702
Interest Rate
7.21%
Create a Home Valuation Report for This Property
The Home Valuation Report is an in-depth analysis detailing your home's value as well as a comparison with similar homes in the area
Home Values in the Area
Average Home Value in this Area
Purchase History
| Date | Buyer | Sale Price | Title Company |
|---|---|---|---|
| Cuevas Jose R | $189,900 | United Title Of Nevada | |
| Crooks Brentt | $125,000 | Land Title | |
| Rhodes Design & Development | $125,000 | Land Title |
Source: Public Records
Mortgage History
| Date | Status | Borrower | Loan Amount |
|---|---|---|---|
| Open | Cuevas Jose R | $170,910 | |
| Previous Owner | Crooks Brentt | $118,702 |
Source: Public Records
Tax History Compared to Growth
Tax History
| Year | Tax Paid | Tax Assessment Tax Assessment Total Assessment is a certain percentage of the fair market value that is determined by local assessors to be the total taxable value of land and additions on the property. | Land | Improvement |
|---|---|---|---|---|
| 2025 | $2,189 | $106,173 | $33,110 | $73,063 |
| 2024 | $2,027 | $106,173 | $33,110 | $73,063 |
| 2023 | $1,350 | $103,351 | $33,880 | $69,471 |
| 2022 | $1,877 | $91,261 | $27,335 | $63,926 |
| 2021 | $1,738 | $86,755 | $25,795 | $60,960 |
| 2020 | $1,611 | $85,730 | $25,025 | $60,705 |
| 2019 | $1,510 | $81,216 | $21,175 | $60,041 |
| 2018 | $1,441 | $76,416 | $18,480 | $57,936 |
| 2017 | $2,137 | $72,864 | $14,000 | $58,864 |
| 2016 | $1,350 | $67,968 | $8,750 | $59,218 |
| 2015 | $1,346 | $47,719 | $7,000 | $40,719 |
| 2014 | $1,307 | $43,233 | $7,000 | $36,233 |
Source: Public Records
Map
Nearby Homes
- 1139 Betty Ln
- 5383 E Washington Ave
- 1385 Ringe Ln
- 4932 E Washington Ave
- 4828 Lakestream Ave
- 4928 E Monroe Ave
- 4809 Sunny Brook Ave
- 4541 E Owens Ave
- 1112 Sandy Cove St
- 0 Washington Unit 2360795
- 5260 Carriellen Ln
- 5717 Christchurch Ave
- 1345 Stokes St
- 730 N Christy Ln
- 1667 Rockwell Ln
- 5754 Cinnabar Ave
- 5772 Cinnabar Ave
- 5275 Hagemann Ln
- 5802 Queenstown Way
- 1009 Greenbank St
- 5220 Baldy Ln
- 1150 Red Iron Way
- 1165 Carefree Peak Ct
- 5235 E Washington Ave
- 1155 Carefree Peak Ct
- 5223 E Washington Ave
- 5247 E Washington Ave
- 1140 Red Iron Way
- 5210 Baldy Ln
- 1170 Carefree Peak Ct
- 1145 Carefree Peak Ct
- 1145 Red Iron Way
- 5211 E Washington Ave
- 5271 E Washington Ave
- 1130 Red Iron Way
- 1135 Red Iron Way
- 1160 Carefree Peak Ct
- 1150 Carefree Peak Ct
- 5194 Baldy Ln
- 5287 E Washington Ave