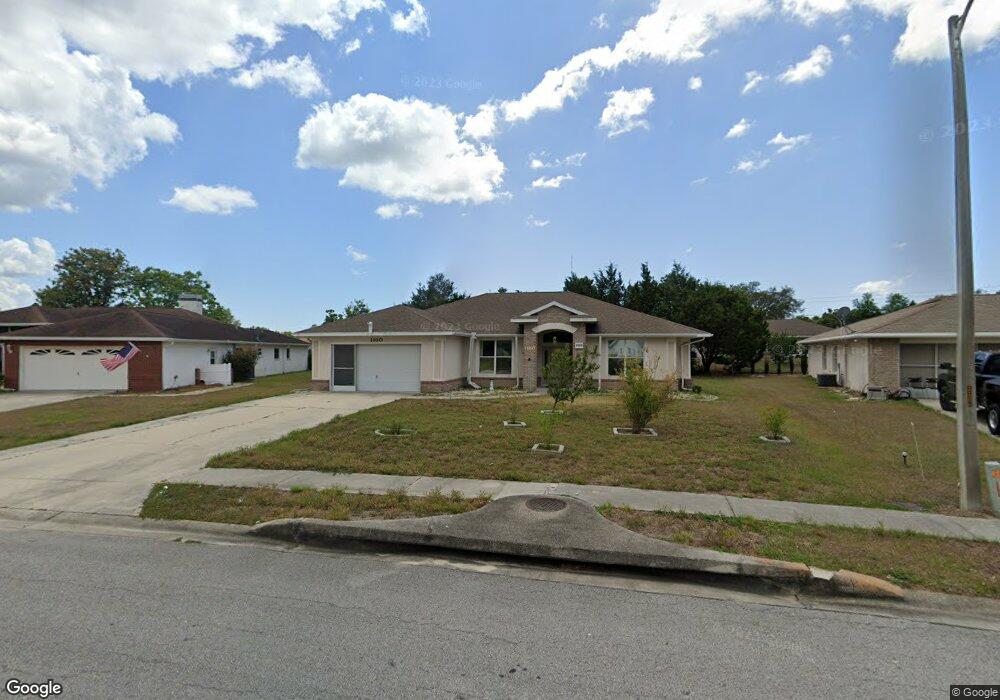
1160 S Softwind Loop Lecanto, FL 34461
Lecanto NeighborhoodEstimated Value: $310,658 - $350,000
3
Beds
2
Baths
2,201
Sq Ft
$152/Sq Ft
Est. Value
About This Home
This home is located at 1160 S Softwind Loop, Lecanto, FL 34461 and is currently estimated at $335,415, approximately $152 per square foot. 1160 S Softwind Loop is a home located in Citrus County with nearby schools including Lecanto Primary School, Lecanto Middle School, and Lecanto High School.
Ownership History
Date
Name
Owned For
Owner Type
Purchase Details
Closed on
Jul 29, 2022
Sold by
Lecanto Investments Inc
Bought by
Tst Lecanto Irf Llc
Current Estimated Value
Purchase Details
Closed on
Jul 29, 2015
Sold by
Lattoz Connie and The Stanley F Lattoz Trust
Bought by
Lattoz Thomas R and The Timothy A Lattoz Special N
Purchase Details
Closed on
Aug 2, 2007
Sold by
Lattoz Stanley F
Bought by
The Stanley F Lattoz Trust
Purchase Details
Closed on
Aug 1, 2007
Bought by
Lattoz Thomas R and Timothy A Lattoz Special Needs
Purchase Details
Closed on
Sep 23, 2003
Sold by
Wheeler Construction Inc
Bought by
Lattoz Stanley F
Home Financials for this Owner
Home Financials are based on the most recent Mortgage that was taken out on this home.
Original Mortgage
$144,000
Interest Rate
6.24%
Mortgage Type
Purchase Money Mortgage
Create a Home Valuation Report for This Property
The Home Valuation Report is an in-depth analysis detailing your home's value as well as a comparison with similar homes in the area
Home Values in the Area
Average Home Value in this Area
Purchase History
| Date | Buyer | Sale Price | Title Company |
|---|---|---|---|
| Tst Lecanto Irf Llc | -- | None Listed On Document | |
| Lattoz Thomas R | -- | Attorney | |
| The Stanley F Lattoz Trust | -- | Attorney | |
| Lattoz Thomas R | $100 | -- | |
| Lattoz Stanley F | $180,300 | Citrus Land Title |
Source: Public Records
Mortgage History
| Date | Status | Borrower | Loan Amount |
|---|---|---|---|
| Previous Owner | Lattoz Stanley F | $144,000 |
Source: Public Records
Tax History Compared to Growth
Tax History
| Year | Tax Paid | Tax Assessment Tax Assessment Total Assessment is a certain percentage of the fair market value that is determined by local assessors to be the total taxable value of land and additions on the property. | Land | Improvement |
|---|---|---|---|---|
| 2025 | $1,556 | $139,167 | -- | -- |
| 2024 | $1,511 | $135,245 | -- | -- |
| 2023 | $1,511 | $131,306 | $0 | $0 |
| 2022 | $1,469 | $127,482 | $0 | $0 |
| 2021 | $1,411 | $123,769 | $0 | $0 |
| 2020 | $1,348 | $164,396 | $14,000 | $150,396 |
| 2019 | $1,328 | $154,901 | $14,000 | $140,901 |
| 2018 | $1,298 | $136,940 | $14,000 | $122,940 |
| 2017 | $1,289 | $114,683 | $12,370 | $102,313 |
| 2016 | $2,134 | $124,682 | $12,370 | $112,312 |
| 2015 | $1,282 | $109,105 | $12,370 | $96,735 |
| 2014 | $1,304 | $108,239 | $10,848 | $97,391 |
Source: Public Records
Map
Nearby Homes
- 1148 S Softwind Loop
- 1137 S Brookfield Dr
- 1075 S Softwind Loop
- 1322 S Brookfield Dr
- 1342 S Brookfield Dr
- 1054 S Brookfield Dr
- 3228 & 3164 W Laurel St
- 620 S Fairlane Terrace
- 3132 W Gulf To Lake Hwy
- 4164 W Gulf To Lake Hwy
- 4610 W Southern St
- 4540 W Sandy Hill St
- 4479 W Homosassa Trail
- 2630 W Gulf To Lake Hwy
- 1805 S Overview Dr
- 649 S West Bend Point
- 2659-2621 W Gulf To Lake Hwy
- 1780 S Hoylake Terrace
- 285 S Spice Wood Terrace
- 2661 N Ezra Terrace
- 1154 S Softwind Loop
- 1174 S Softwind Loop
- 1195 S Brookfield Dr
- 1189 S Brookfield Dr
- 1182 S Softwind Loop
- 1205 S Brookfield Dr
- 1167 S Brookfield Dr
- 1153 S Softwind Loop
- 0 S Brookfield Dr
- 1075 S Brookfield Dr
- 1155 S Brookfield Dr
- 3951 W Fieldwood Ct
- 1140 S Softwind Loop
- 3959 W Fieldwood Ct
- 1192 S Softwind Loop
- 1145 S Softwind Loop
- 0 S Softwind Loop
- 1195 S Softwind Loop
- 3935 W Fieldwood Ct
- 1190 S Brookfield Dr