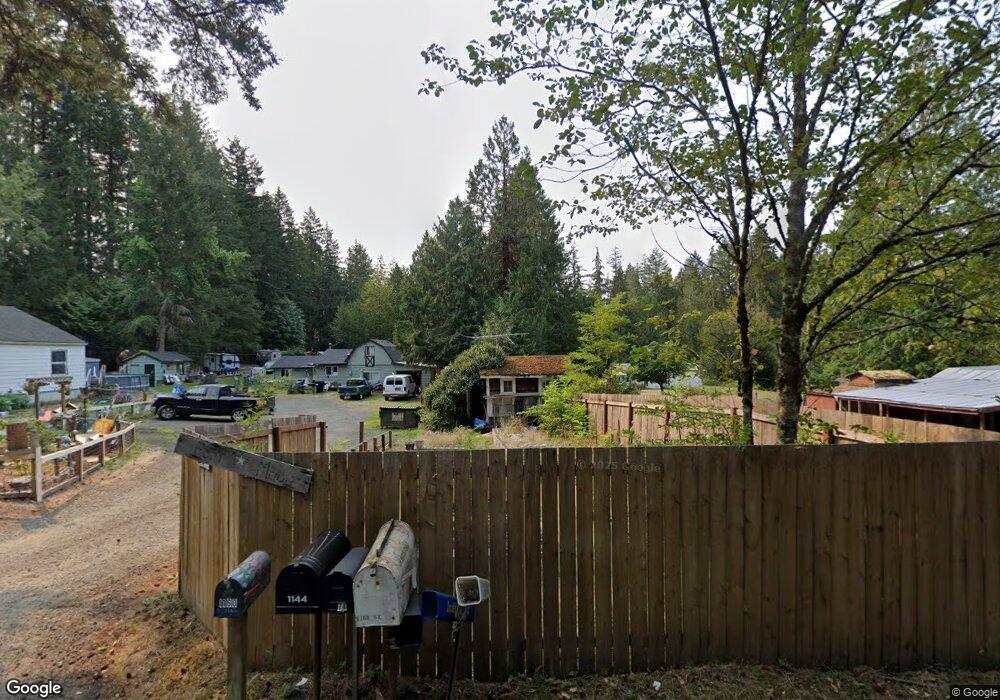
1160 SE Deep Lake Rd Port Orchard, WA 98367
Estimated Value: $530,000 - $551,000
3
Beds
2
Baths
1,458
Sq Ft
$371/Sq Ft
Est. Value
About This Home
This home is located at 1160 SE Deep Lake Rd, Port Orchard, WA 98367 and is currently estimated at $540,262, approximately $370 per square foot. 1160 SE Deep Lake Rd is a home located in Kitsap County with nearby schools including Hidden Creek Elementary School, Marcus Whitman Middle School, and South Kitsap High School.
Ownership History
Date
Name
Owned For
Owner Type
Purchase Details
Closed on
Jun 21, 2014
Sold by
Anderson Leif O and Anderson Anne Marie
Bought by
Anderson Leif O
Current Estimated Value
Home Financials for this Owner
Home Financials are based on the most recent Mortgage that was taken out on this home.
Original Mortgage
$126,000
Outstanding Balance
$67,857
Interest Rate
4.1%
Mortgage Type
New Conventional
Estimated Equity
$472,405
Purchase Details
Closed on
Nov 6, 2003
Sold by
Walgren Thomas E and Walgren Micki M
Bought by
Anderson Leif O
Home Financials for this Owner
Home Financials are based on the most recent Mortgage that was taken out on this home.
Original Mortgage
$149,500
Interest Rate
5.72%
Mortgage Type
Purchase Money Mortgage
Purchase Details
Closed on
Oct 29, 1997
Sold by
Emcee Inc
Bought by
Walgren Thomas E and Walgren Micki M
Home Financials for this Owner
Home Financials are based on the most recent Mortgage that was taken out on this home.
Original Mortgage
$110,000
Interest Rate
7.3%
Mortgage Type
Seller Take Back
Purchase Details
Closed on
Dec 23, 1996
Sold by
Rice Loretta M and Craft Richard W
Bought by
Emcee Inc
Create a Home Valuation Report for This Property
The Home Valuation Report is an in-depth analysis detailing your home's value as well as a comparison with similar homes in the area
Home Values in the Area
Average Home Value in this Area
Purchase History
| Date | Buyer | Sale Price | Title Company |
|---|---|---|---|
| Anderson Leif O | -- | First American Title | |
| Anderson Leif O | $149,500 | Land Title Company | |
| Walgren Thomas E | $115,000 | Charter Title Corp | |
| Emcee Inc | $82,000 | Transnation Title Insurance |
Source: Public Records
Mortgage History
| Date | Status | Borrower | Loan Amount |
|---|---|---|---|
| Open | Anderson Leif O | $126,000 | |
| Closed | Anderson Leif O | $149,500 | |
| Previous Owner | Walgren Thomas E | $110,000 |
Source: Public Records
Tax History Compared to Growth
Tax History
| Year | Tax Paid | Tax Assessment Tax Assessment Total Assessment is a certain percentage of the fair market value that is determined by local assessors to be the total taxable value of land and additions on the property. | Land | Improvement |
|---|---|---|---|---|
| 2026 | $4,627 | $512,890 | $119,540 | $393,350 |
| 2025 | $4,627 | $512,890 | $119,540 | $393,350 |
| 2024 | $4,488 | $512,890 | $119,540 | $393,350 |
| 2023 | $4,456 | $512,890 | $119,540 | $393,350 |
| 2022 | $4,256 | $409,960 | $95,280 | $314,680 |
| 2021 | $4,044 | $368,800 | $86,620 | $282,180 |
| 2020 | $3,320 | $290,970 | $82,330 | $208,640 |
| 2019 | $2,825 | $270,040 | $76,090 | $193,950 |
| 2018 | $2,985 | $220,250 | $65,490 | $154,760 |
| 2017 | $2,536 | $220,250 | $65,490 | $154,760 |
| 2016 | $2,483 | $197,540 | $62,370 | $135,170 |
| 2015 | $2,400 | $193,630 | $62,370 | $131,260 |
| 2014 | -- | $184,620 | $58,500 | $126,120 |
| 2013 | -- | $184,620 | $58,500 | $126,120 |
Source: Public Records
Map
Nearby Homes
- 0 SE Bethel Rd Unit NWM2437882
- 5 XXX Ferate Ave SE
- 1577 SE Oregon St
- 203 SW Dogwood Rd
- 2256 SE Bandera Ct
- 5673 Bethel Rd SE Unit 28
- 7988 Bethel Burley Rd SE
- 5230 Bethel Rd SE
- 6830 Arlington Place SE
- 2670 SE Bielmeier Rd
- 825 SW Winter Spring Ln
- 5230 Sidney Rd SW
- 2430 SE Celebrity Ct
- 818 SW Taft Blvd
- 2569 SE Spring Creek Rd
- 0 Geiger Rd SE
- 15081 Glenwood Rd SW
- 2426 SE Celebrity Ct
- 1073 Sedgewick
- 6358 Great Glen Rd SW
- 0 5 Lots SE Deep Lake Rd
- 0 SE Deep Lake Rd
- 1158 SE Deep Lake Rd
- 0 SE van Skiver Rd
- 1072 SE Deep Lake Rd
- 90 SE Bielmeier Rd Unit 90
- 1168 SE Deep Lake Rd
- 1200 SE Deep Lake Rd
- 959 SE Deep Lake Rd
- 1210 SE Deep Lake Rd
- 1012 SE Deep Lake Rd
- 898 SE Deep Lake Rd
- 1228 SE Deep Lake Rd
- 899 SE Deep Lake Rd
- 864 SE Deep Lake Rd
- 1550 SE Deep Lake Rd
- 1538 SE Lider Rd
- 1590 SE Deep Lake Rd
- 1505 SE Lider Rd