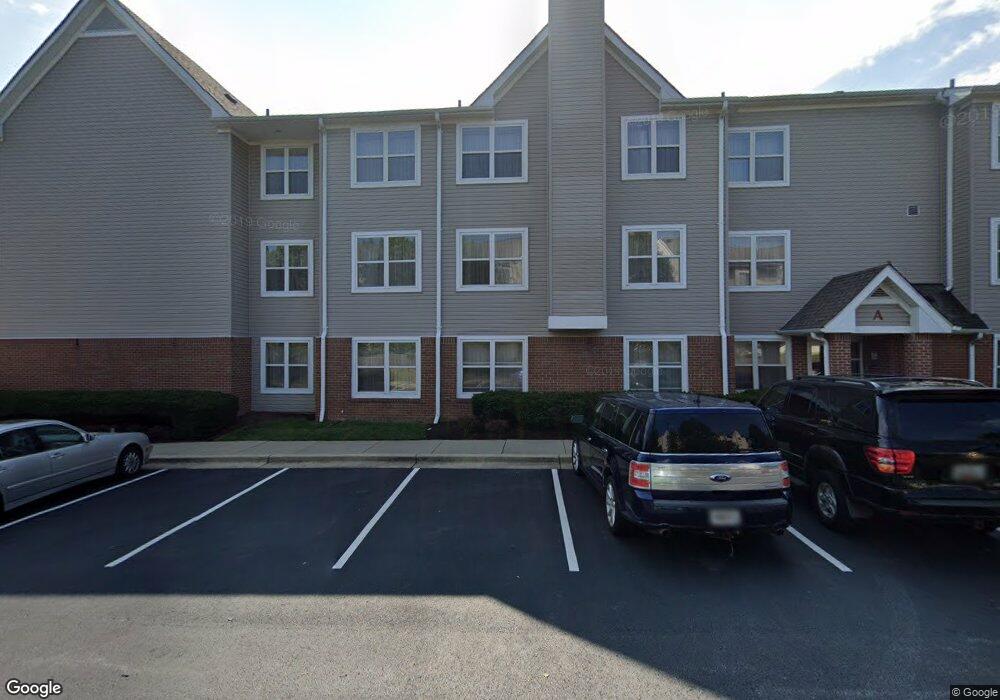
1160 Winterson Rd Linthicum, MD 21090
Estimated Value: $40,666,024
Studio
--
Bath
91,041
Sq Ft
$447/Sq Ft
Est. Value
About This Home
This home is located at 1160 Winterson Rd, Linthicum, MD 21090 and is currently estimated at $40,666,024, approximately $446 per square foot. 1160 Winterson Rd is a home located in Anne Arundel County with nearby schools including Linthicum Elementary School, Lindale Middle School, and North County High School.
Ownership History
Date
Name
Owned For
Owner Type
Purchase Details
Closed on
Sep 18, 2025
Sold by
Hptmi Properties Trust
Bought by
Cwp-Asr Baltimore I Llc and Cwp-Asr Baltimore Ii Llc
Current Estimated Value
Purchase Details
Closed on
Jun 22, 2011
Sold by
Hptmi Ii Properties Trust
Bought by
Hptmi Properties Trust
Purchase Details
Closed on
Jun 13, 2011
Sold by
Hptmi Ii Properties Trust
Bought by
Hptmi Properties Trust
Purchase Details
Closed on
Dec 23, 1997
Sold by
Residence Inn By Marriott Inc
Bought by
Hptmi Ii Properties Trust
Purchase Details
Closed on
Dec 16, 1997
Sold by
United Properties
Bought by
Bwi Hotel Associates L P and Limited Partnership
Purchase Details
Closed on
Nov 12, 1996
Sold by
United Properties
Bought by
Residence Inn By Marriott Inc
Create a Home Valuation Report for This Property
The Home Valuation Report is an in-depth analysis detailing your home's value as well as a comparison with similar homes in the area
Home Values in the Area
Average Home Value in this Area
Purchase History
| Date | Buyer | Sale Price | Title Company |
|---|---|---|---|
| Cwp-Asr Baltimore I Llc | $850,000 | None Listed On Document | |
| Hptmi Properties Trust | -- | -- | |
| Hptmi Properties Trust | -- | Stewart Title Of Maryland | |
| Hptmi Properties Trust | -- | -- | |
| Hptmi Ii Properties Trust | $11,451,000 | -- | |
| Bwi Hotel Associates L P | $758,400 | -- | |
| Residence Inn By Marriott Inc | $1,027,000 | -- |
Source: Public Records
Tax History
| Year | Tax Paid | Tax Assessment Tax Assessment Total Assessment is a certain percentage of the fair market value that is determined by local assessors to be the total taxable value of land and additions on the property. | Land | Improvement |
|---|---|---|---|---|
| 2025 | $95,214 | $8,392,600 | $2,255,000 | $6,137,600 |
| 2024 | $95,214 | $8,379,467 | $0 | $0 |
| 2023 | $99,014 | $8,765,367 | $0 | $0 |
| 2022 | $94,623 | $8,754,400 | $2,255,000 | $6,499,400 |
| 2020 | $174,661 | $16,401,333 | $0 | $0 |
| 2019 | $160,401 | $15,020,400 | $1,804,000 | $13,216,400 |
| 2018 | $141,076 | $13,912,867 | $0 | $0 |
| 2017 | $143,344 | $13,773,733 | $0 | $0 |
| 2016 | -- | $11,697,800 | $0 | $0 |
| 2015 | -- | $11,000,133 | $0 | $0 |
| 2014 | -- | $10,988,600 | $0 | $0 |
Source: Public Records
Map
Nearby Homes
- 534 Cleveland Rd
- 536 Forest View Rd
- 504 Cleveland Rd
- 1006 & 1008 Old Elkridge Landing Dr
- 1200 Old Elkridge Landing Rd
- 105 Michael Ave
- 312 N Hammonds Ferry Rd
- 300 Twin Oaks Rd
- 518 N Rd
- 102 Catalpa Rd
- 1319 German Driveway
- 7047 Fox Glove Ln
- 6811 Morrow Mountain Rd
- 1646 Aster Ln
- 1624 Aster Ln
- 1605 Aster Ln
- 100 Governors Gate Ln
- 6709 Deep Run Trail
- 451 Susan Ct
- 1337 German Driveway
- 1170 Winterson Rd
- 1171 Winterson Rd
- 1190 Winterson Rd
- 1591 W Nursery Rd
- 1181 Winterson Rd
- 1595 W Nursery Rd
- 1199 Winterson Rd
- 1589 W Nursery Rd
- 1018 Andover Rd
- 820 Concorde Cir Unit FL2-ID8816A
- 820 Concorde Cir Unit FL4-ID9095A
- 820 Concorde Cir Unit FL4-ID9089A
- 820 Concorde Cir Unit FL4-ID2686A
- 820 Concorde Cir Unit FL2-ID9073A
- 820 Concorde Cir Unit FL4-ID8984A
- 820 Concorde Cir Unit FL4-ID8907A
- 820 Concorde Cir Unit FL4-ID8924A
- 820 Concorde Cir Unit FL1-ID8874A
- 820 Concorde Cir Unit FL2-ID1778A
- 820 Concorde Cir Unit FL1-ID2046A
Your Personal Tour Guide
Ask me questions while you tour the home.