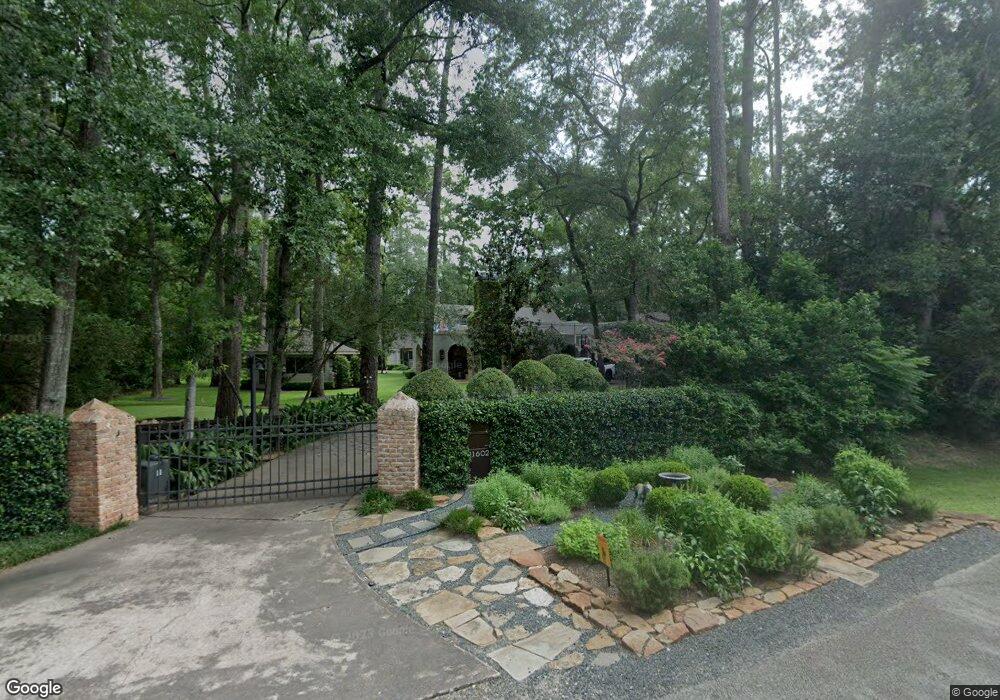
11602 Greenbay St Houston, TX 77024
Estimated Value: $2,906,000 - $3,684,000
4
Beds
4
Baths
6,419
Sq Ft
$511/Sq Ft
Est. Value
About This Home
This home is located at 11602 Greenbay St, Houston, TX 77024 and is currently estimated at $3,277,808, approximately $510 per square foot. 11602 Greenbay St is a home located in Harris County with nearby schools including Memorial Drive Elementary School, Spring Branch Middle School, and Memorial High School.
Ownership History
Date
Name
Owned For
Owner Type
Purchase Details
Closed on
Feb 13, 2012
Sold by
May Gordon Marie and May Houston Shirley
Bought by
Apex Heritage Properties Llc
Current Estimated Value
Home Financials for this Owner
Home Financials are based on the most recent Mortgage that was taken out on this home.
Original Mortgage
$3,034,925
Interest Rate
3.95%
Mortgage Type
Purchase Money Mortgage
Purchase Details
Closed on
May 21, 2003
Sold by
Fleetwood Millard D and Fleetwood Yvonne C
Bought by
Madden Steven H and Madden Kelly M
Home Financials for this Owner
Home Financials are based on the most recent Mortgage that was taken out on this home.
Original Mortgage
$1,250,000
Interest Rate
5.79%
Mortgage Type
Purchase Money Mortgage
Create a Home Valuation Report for This Property
The Home Valuation Report is an in-depth analysis detailing your home's value as well as a comparison with similar homes in the area
Home Values in the Area
Average Home Value in this Area
Purchase History
| Date | Buyer | Sale Price | Title Company |
|---|---|---|---|
| Apex Heritage Properties Llc | -- | None Available | |
| Madden Steven H | -- | Charter Title Company |
Source: Public Records
Mortgage History
| Date | Status | Borrower | Loan Amount |
|---|---|---|---|
| Previous Owner | Apex Heritage Properties Llc | $3,034,925 | |
| Previous Owner | Madden Steven H | $1,250,000 |
Source: Public Records
Tax History Compared to Growth
Tax History
| Year | Tax Paid | Tax Assessment Tax Assessment Total Assessment is a certain percentage of the fair market value that is determined by local assessors to be the total taxable value of land and additions on the property. | Land | Improvement |
|---|---|---|---|---|
| 2025 | $39,441 | $3,078,913 | $1,897,686 | $1,181,227 |
| 2024 | $39,441 | $2,647,791 | $1,897,686 | $750,105 |
| 2023 | $39,441 | $2,594,638 | $1,897,686 | $696,952 |
| 2022 | $45,744 | $2,225,000 | $1,897,686 | $327,314 |
| 2021 | $49,567 | $2,316,682 | $1,755,360 | $561,322 |
| 2020 | $46,081 | $2,080,706 | $1,755,360 | $325,346 |
| 2019 | $48,435 | $2,099,781 | $1,755,360 | $344,421 |
| 2018 | $11,179 | $2,200,000 | $1,755,360 | $444,640 |
| 2017 | $50,747 | $2,200,000 | $1,755,360 | $444,640 |
| 2016 | $48,755 | $2,200,000 | $1,755,360 | $444,640 |
| 2015 | $33,106 | $2,200,000 | $1,755,360 | $444,640 |
| 2014 | $33,106 | $2,179,000 | $1,755,360 | $423,640 |
Source: Public Records
Map
Nearby Homes
- 11607 Shady Grove Ln
- 11640 Greenbay St
- 11607 Barazi Oaks Ct
- 11305 Green Vale Dr
- 11706 Flintwood Dr
- 11722 Claywood St
- 11606 Blalock Ln
- 354 Piney Point Rd
- 435 Flint Point Dr
- 625 Piney Point Rd
- 534 Lanecrest Ln
- 252 Piney Point Rd
- 318 Knipp Rd
- 9 Leisure Ln
- 247 Piney Point Rd
- 1 Chuckanut Ln
- 534 W Dana Ln
- 345 Knipp Rd
- 570 Lanecrest Ln
- 8 Jeffers Ct
- 11603 Mockingbird Ln
- 402 Flintdale Rd
- 4 Blalock Cir
- 1 Blalock Cir
- 421 Blalock Rd
- 406 Flintdale Rd
- 11623 Greenbay St
- 11606 Mockingbird Ln
- 449 Blalock Rd
- 11619 Greenbay St
- 450 Blalock Rd
- 11535 Quail Hollow Ln
- 3 Blalock Cir
- 11610 Mockingbird Ln
- 2 Blalock Cir
- 448 Blalock Rd
- 11614 Mockingbird Ln
- 403 Flintdale Rd
- 11627 Greenbay St
- 1 Dunnam Ln