11608 NE 30th Ct Vancouver, WA 98686
Estimated Value: $725,000 - $1,278,000
5
Beds
4
Baths
3,600
Sq Ft
$256/Sq Ft
Est. Value
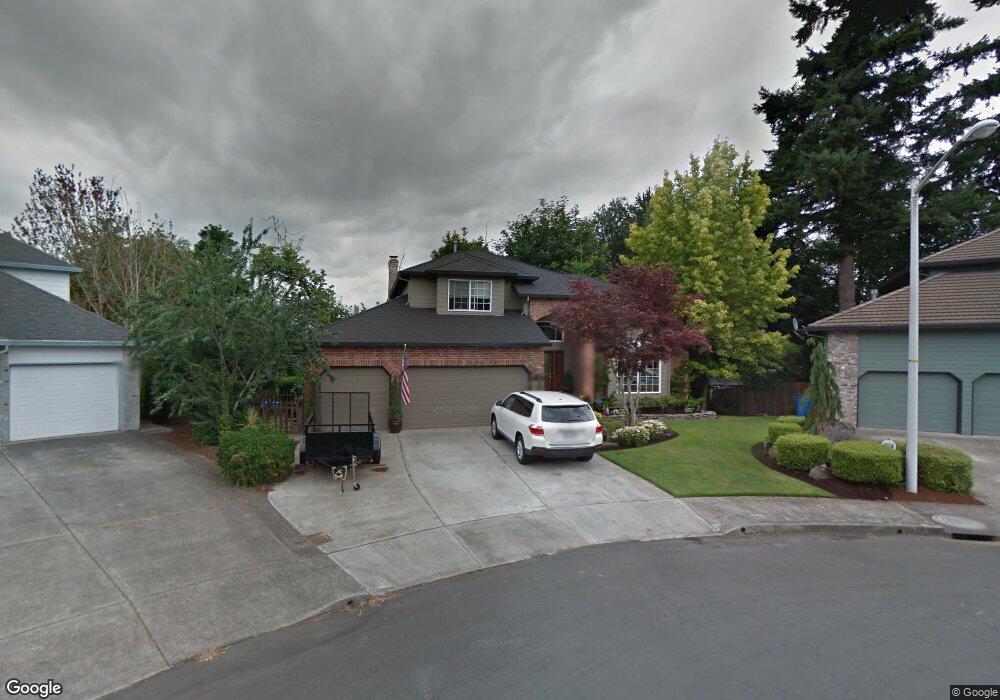
About This Home
This home is located at 11608 NE 30th Ct, Vancouver, WA 98686 and is currently estimated at $921,937, approximately $256 per square foot. 11608 NE 30th Ct is a home located in Clark County with nearby schools including Sarah J. Anderson Elementary School, Gaiser Middle School, and Skyview High School.
Ownership History
Date
Name
Owned For
Owner Type
Purchase Details
Closed on
Sep 29, 2017
Sold by
Cornell Benjamin G and Cornell Amber
Bought by
Yeti Properties Llc
Current Estimated Value
Purchase Details
Closed on
Mar 12, 2004
Sold by
Williams Patrick J
Bought by
Golemo Eric E and Golemo Yvette S
Home Financials for this Owner
Home Financials are based on the most recent Mortgage that was taken out on this home.
Original Mortgage
$323,850
Interest Rate
5.65%
Mortgage Type
Purchase Money Mortgage
Purchase Details
Closed on
Dec 15, 1999
Sold by
Simonetta Paul J and Simonetta Antonia L
Bought by
Williams Patrick J
Home Financials for this Owner
Home Financials are based on the most recent Mortgage that was taken out on this home.
Original Mortgage
$299,250
Interest Rate
9.49%
Create a Home Valuation Report for This Property
The Home Valuation Report is an in-depth analysis detailing your home's value as well as a comparison with similar homes in the area
Home Values in the Area
Average Home Value in this Area
Purchase History
| Date | Buyer | Sale Price | Title Company |
|---|---|---|---|
| Yeti Properties Llc | $220,000 | Chicago Title Vancouver | |
| Golemo Eric E | $404,850 | First American Title | |
| Williams Patrick J | $315,000 | Chicago Title Insurance |
Source: Public Records
Mortgage History
| Date | Status | Borrower | Loan Amount |
|---|---|---|---|
| Previous Owner | Golemo Eric E | $323,850 | |
| Previous Owner | Williams Patrick J | $299,250 | |
| Closed | Golemo Eric E | $60,700 |
Source: Public Records
Tax History Compared to Growth
Tax History
| Year | Tax Paid | Tax Assessment Tax Assessment Total Assessment is a certain percentage of the fair market value that is determined by local assessors to be the total taxable value of land and additions on the property. | Land | Improvement |
|---|---|---|---|---|
| 2025 | $7,383 | $788,124 | $231,000 | $557,124 |
| 2024 | $6,894 | $703,019 | $231,000 | $472,019 |
| 2023 | $6,803 | $708,569 | $231,000 | $477,569 |
| 2022 | $6,665 | $693,571 | $224,250 | $469,321 |
| 2021 | $6,409 | $605,442 | $145,400 | $460,042 |
| 2020 | $6,040 | $546,266 | $140,600 | $405,666 |
| 2019 | $5,438 | $547,138 | $140,600 | $406,538 |
| 2018 | $6,018 | $511,263 | $0 | $0 |
| 2017 | $5,337 | $472,452 | $0 | $0 |
| 2016 | $5,350 | $436,499 | $0 | $0 |
| 2015 | $5,155 | $409,507 | $0 | $0 |
| 2014 | -- | $380,814 | $0 | $0 |
| 2013 | -- | $342,926 | $0 | $0 |
Source: Public Records
Map
Nearby Homes
- 11619 NE 36th Ct
- 12215 NE Salmon Creek Ave
- 2729 NE 125th St
- 3612 NE 113th St
- 10805 NE 27th Ct
- 10619 NE 30th Ave
- 3616 NE 170th St
- 16709 NE 38th Ave
- 16713 NE 38th Ave
- 16705 NE 38th Ave
- 11313 NE Highway 99
- 2806 NE 105th Cir
- 10702 NE 37th Ct
- 3108 NE 105th Cir
- 11716 NE 42nd Ct
- 1715 NE 116th St
- 12800 NE Salmon Creek Ave Unit 119
- 6717 NE 27th Place
- 6401 NE 123rd St
- 10307 NE 33rd Ct
- 11606 NE 30th Ct
- 11605 NE 30th Ct
- 11602 NE 30th Ct
- 11603 NE 30th Ct
- 11605 NE 29th Ave
- 3202 NE 116th St
- 3012 NE 116th St
- 2820 NE 116th St
- 11609 NE 29th Ave
- 3206 NE 116th St
- 11504 NE 30th Ave
- 3003 NE 116th St
- 11501 NE 29th Ave
- 3210 NE 116th St
- 3011 NE 116th St
- 11418 NE 30th Ave
- 11516 NE 29th Ave
- 3002 NE 115th Cir
- 3205 NE 116th St
- 3015 NE 116th St