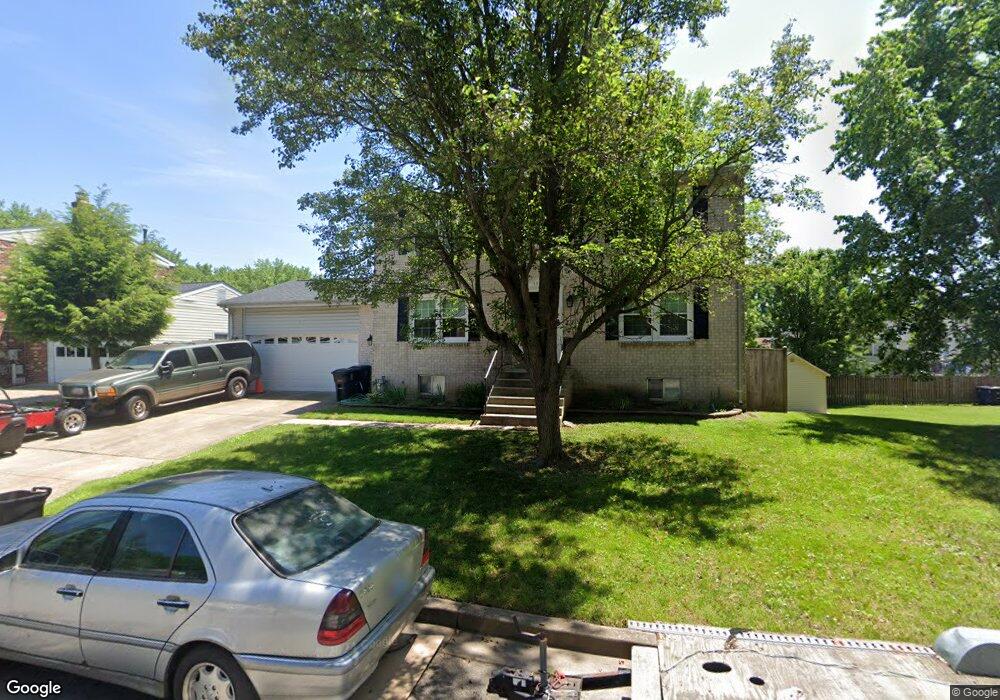
11608 Sylvia Ln Clinton, MD 20735
Estimated Value: $402,309 - $507,000
--
Bed
3
Baths
2,016
Sq Ft
$222/Sq Ft
Est. Value
About This Home
This home is located at 11608 Sylvia Ln, Clinton, MD 20735 and is currently estimated at $446,577, approximately $221 per square foot. 11608 Sylvia Ln is a home located in Prince George's County with nearby schools including Waldon Woods Elementary School, Stephen Decatur Middle School, and Surrattsville High School.
Ownership History
Date
Name
Owned For
Owner Type
Purchase Details
Closed on
Oct 26, 2007
Sold by
Choice William E & Dedre D
Bought by
Choice Dedre D
Current Estimated Value
Home Financials for this Owner
Home Financials are based on the most recent Mortgage that was taken out on this home.
Original Mortgage
$250,000
Outstanding Balance
$158,355
Interest Rate
6.49%
Mortgage Type
Stand Alone Refi Refinance Of Original Loan
Estimated Equity
$288,222
Purchase Details
Closed on
Sep 28, 2007
Sold by
Choice William E & Dedre D
Bought by
Choice Dedre D
Home Financials for this Owner
Home Financials are based on the most recent Mortgage that was taken out on this home.
Original Mortgage
$250,000
Outstanding Balance
$158,355
Interest Rate
6.49%
Mortgage Type
Stand Alone Refi Refinance Of Original Loan
Estimated Equity
$288,222
Purchase Details
Closed on
Feb 25, 1991
Sold by
Oaklawn Builders
Bought by
Choice William E and Choice Dedre D
Create a Home Valuation Report for This Property
The Home Valuation Report is an in-depth analysis detailing your home's value as well as a comparison with similar homes in the area
Home Values in the Area
Average Home Value in this Area
Purchase History
| Date | Buyer | Sale Price | Title Company |
|---|---|---|---|
| Choice Dedre D | -- | -- | |
| Choice Dedre D | -- | -- | |
| Choice William E | $162,100 | -- |
Source: Public Records
Mortgage History
| Date | Status | Borrower | Loan Amount |
|---|---|---|---|
| Open | Choice Dedre D | $250,000 | |
| Closed | Choice Dedre D | $250,000 |
Source: Public Records
Tax History Compared to Growth
Tax History
| Year | Tax Paid | Tax Assessment Tax Assessment Total Assessment is a certain percentage of the fair market value that is determined by local assessors to be the total taxable value of land and additions on the property. | Land | Improvement |
|---|---|---|---|---|
| 2025 | $5,651 | $386,000 | $100,400 | $285,600 |
| 2024 | $5,651 | $353,433 | $0 | $0 |
| 2023 | $3,568 | $320,867 | $0 | $0 |
| 2022 | $4,682 | $288,300 | $100,400 | $187,900 |
| 2021 | $4,564 | $280,367 | $0 | $0 |
| 2020 | $4,446 | $272,433 | $0 | $0 |
| 2019 | $4,328 | $264,500 | $100,200 | $164,300 |
| 2018 | $4,240 | $258,533 | $0 | $0 |
| 2017 | $4,151 | $252,567 | $0 | $0 |
| 2016 | -- | $246,600 | $0 | $0 |
| 2015 | $3,911 | $241,833 | $0 | $0 |
| 2014 | $3,911 | $237,067 | $0 | $0 |
Source: Public Records
Map
Nearby Homes
- 5845 E Boniwood Turn
- 11614 Cosca Park Dr
- 12212 Birchview Dr
- 5623 E Boniwood Turn
- 11505 Cosca Park Place
- 11403 Cosca Park Place
- 11524 Cosca Park Place
- 11400 Cosca Park Place
- 11711 Butlers Branch Rd
- 5510 E Boniwood Turn
- 11603 Butlers Branch Rd
- 5505 E Boniwood Turn
- 5210 W Boniwood Turn
- 6205 Brooke Jane Dr
- 11106 Teaberry Way Ct
- 11403 Hershey Red Place
- 11422 Brandywine Rd
- 6208 Teaberry Way
- 11313 Marlee Ave
- 6309 Elm Way
- 11606 Sylvia Ln
- 5924 E Boniwood Turn
- 5930 E Boniwood Turn
- 5928 E Boniwood Turn
- 5910 Sylvia Ct
- 11609 Sylvia Ln
- 5912 Sylvia Ct
- 11604 Sylvia Ln
- 11605 Sylvia Ln
- 5902 E Boniwood Turn
- 5932 E Boniwood Turn
- 5934 E Boniwood Turn
- 11602 Sylvia Ln
- 5908 Sylvia Ct
- 5923 E Boniwood Turn
- 11603 Sylvia Ln
- 11600 Sylvia Ln
- 5925 E Boniwood Turn
- 5903 Boniwood
- 5903 E Boniwood Turn