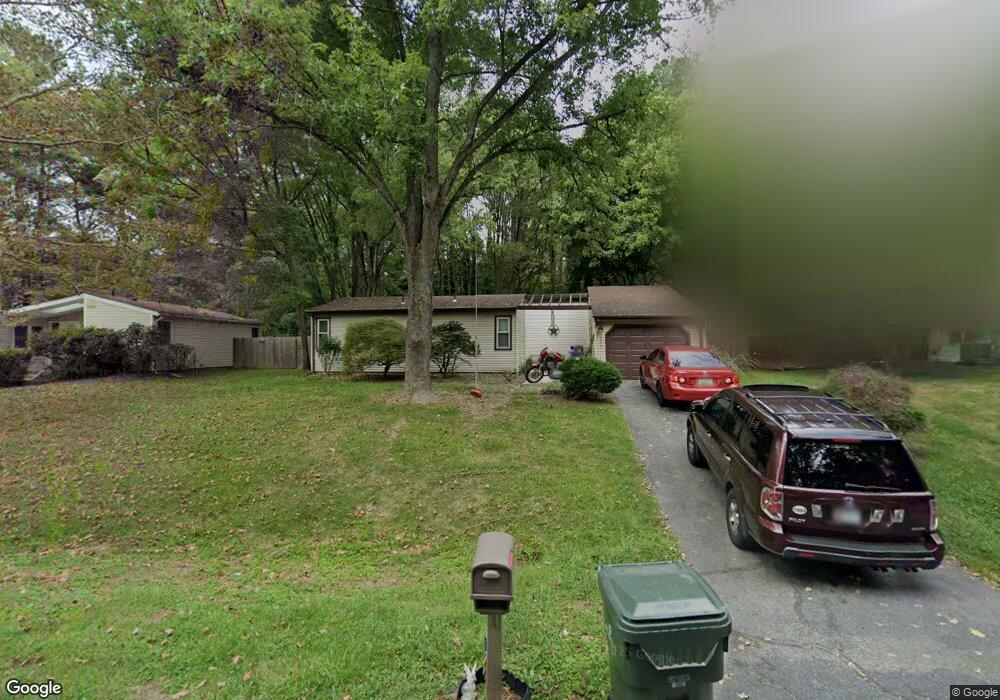
11609 Cherry Grove Dr North Potomac, MD 20878
Estimated Value: $587,721 - $616,000
4
Beds
2
Baths
1,340
Sq Ft
$453/Sq Ft
Est. Value
About This Home
This home is located at 11609 Cherry Grove Dr, North Potomac, MD 20878 and is currently estimated at $607,680, approximately $453 per square foot. 11609 Cherry Grove Dr is a home located in Montgomery County with nearby schools including Thurgood Marshall Elementary School, Madison Middle School, and Ridgeview Middle School.
Ownership History
Date
Name
Owned For
Owner Type
Purchase Details
Closed on
Jan 11, 2017
Sold by
Coughlin Robert J and Coughlin Mary Lou
Bought by
Coughlin Robert J and Coughlin Mary Lou
Current Estimated Value
Purchase Details
Closed on
Oct 17, 2008
Sold by
Ler S S
Bought by
Coughlin Robert J
Home Financials for this Owner
Home Financials are based on the most recent Mortgage that was taken out on this home.
Original Mortgage
$368,150
Outstanding Balance
$244,812
Interest Rate
6.43%
Mortgage Type
FHA
Estimated Equity
$362,868
Purchase Details
Closed on
Sep 26, 2008
Sold by
Ler S S
Bought by
Coughlin Robert J
Home Financials for this Owner
Home Financials are based on the most recent Mortgage that was taken out on this home.
Original Mortgage
$368,150
Outstanding Balance
$244,812
Interest Rate
6.43%
Mortgage Type
FHA
Estimated Equity
$362,868
Purchase Details
Closed on
Nov 8, 1999
Sold by
Azim Jalal O
Bought by
Sandler Samantha
Create a Home Valuation Report for This Property
The Home Valuation Report is an in-depth analysis detailing your home's value as well as a comparison with similar homes in the area
Home Values in the Area
Average Home Value in this Area
Purchase History
| Date | Buyer | Sale Price | Title Company |
|---|---|---|---|
| Coughlin Robert J | -- | None Available | |
| Coughlin Robert J | $377,000 | -- | |
| Coughlin Robert J | $377,000 | -- | |
| Sandler Samantha | $153,900 | -- |
Source: Public Records
Mortgage History
| Date | Status | Borrower | Loan Amount |
|---|---|---|---|
| Open | Coughlin Robert J | $368,150 | |
| Closed | Coughlin Robert J | $368,150 |
Source: Public Records
Tax History Compared to Growth
Tax History
| Year | Tax Paid | Tax Assessment Tax Assessment Total Assessment is a certain percentage of the fair market value that is determined by local assessors to be the total taxable value of land and additions on the property. | Land | Improvement |
|---|---|---|---|---|
| 2025 | $4,914 | $403,867 | -- | -- |
| 2024 | $4,914 | $388,000 | $237,400 | $150,600 |
| 2023 | $5,428 | $374,667 | $0 | $0 |
| 2022 | $3,703 | $361,333 | $0 | $0 |
| 2021 | $3,478 | $348,000 | $226,100 | $121,900 |
| 2020 | $3,478 | $348,000 | $226,100 | $121,900 |
| 2019 | $3,463 | $348,000 | $226,100 | $121,900 |
| 2018 | $3,503 | $351,700 | $226,100 | $125,600 |
| 2017 | $3,444 | $340,167 | $0 | $0 |
| 2016 | $3,017 | $328,633 | $0 | $0 |
| 2015 | $3,017 | $317,100 | $0 | $0 |
| 2014 | $3,017 | $317,100 | $0 | $0 |
Source: Public Records
Map
Nearby Homes
- 869 Still Creek Ln
- 5 Winesap Ct
- 47 Dufief Ct
- 520 Kersten St
- 15428 Peach Leaf Dr
- 9 Joshua Tree Ct
- 713 Bright Meadow Dr
- 14908 Pomquay Ct
- 444 Clayhall St
- 528 Market Mews E
- 403 Kent Oaks Way
- 449 Leaning Oak St
- 14865 Dufief Dr
- 328 Inspiration Ln
- 422 Chestnut Hill St
- 11120 Rutledge Dr
- 14 Treworthy Rd
- 12233 Quince Valley Dr
- 313 Hart Rd
- 12307 Sweetbough Ct
- 11613 Cherry Grove Dr
- 11605 Cherry Grove Dr
- 11617 Cherry Grove Dr
- 15505 Ambiance Dr
- 11601 Cherry Grove Dr
- 15405 Pin Cherry Ln
- 15501 Ambiance Dr
- 15401 Pin Cherry Ln
- 15509 Ambiance Dr
- 11525 Cherry Grove Dr
- 11620 Cherry Grove Dr
- 15513 Ambiance Dr
- 11524 Cherry Grove Dr
- 15500 Ambiance Dr
- 15412 Pin Cherry Ln
- 11521 Cherry Grove Dr
- 11624 Cherry Grove Dr
- 11520 Cherry Grove Dr
- 15517 Ambiance Dr
- 15510 Ambiance Dr