
Seller's Agent in 2026
Leo Rowen
RE/MAX
(303) 521-0360
1 in this area
398 Total Sales


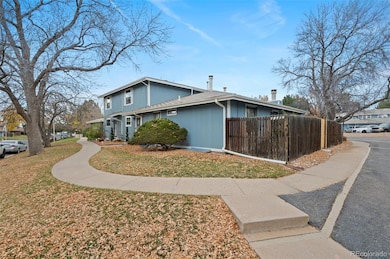
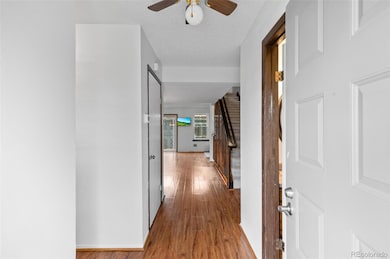
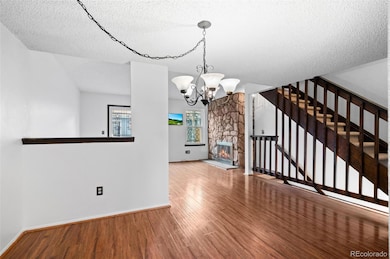
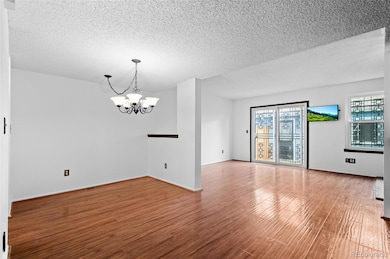
Explore this fantastic opportunity, whether you're seeking your first home or aiming to downsize or any buyer. This nicely updated townhouse with new paint and carpet with 2-bedroom, conveniently located near Aurora Hills Golf Course, offers seamless access to shopping, Lowry, and major highways for easy commuting within the metro area. Step into a clean kitchen with sleek stainless-steel appliances that will surely captivate your culinary senses. The main floor family room, complemented by a charming wood-burning fireplace, seamlessly connects to the generously sized dining room, creating a comfortable flow for both relaxation and entertainment. Nice and Unique to have your own outside space to grill out, have a pet and just enjoy the great Colorado weather. Upstairs, two well-appointed bedrooms await, providing cozy retreats. Additionally, the finished basement level offers versatility with a lot of hang out space, another fireplace, option to add a 3rd bedroom, additional storage space and a convenient Three Quarter-bath. The generously proportioned 2 car garage not only accommodates a vehicle but also offers the possibility of extra storage space. Embrace the community's amenities as you'll be mere steps away from the inviting clubhouse and refreshing pool, promising delightful moments on sun-soaked Colorado days. Don't hesitate—secure your viewing appointment today before this exceptional gem slips through your fingers!
Last Agent to Sell the Property
RE/MAX of Cherry Creek Brokerage Email: leo@rowenrealty.com,303-521-0360 License #40026894 Listed on: 11/10/2025
| Date | Type | Sale Price | Title Company |
|---|---|---|---|
| Personal Reps Deed | $275,000 | None Listed On Document | |
| Quit Claim Deed | -- | -- | |
| Warranty Deed | $77,000 | Land Title | |
| Deed | -- | -- | |
| Deed | -- | -- | |
| Deed | -- | -- |
| Date | Status | Loan Amount | Loan Type |
|---|---|---|---|
| Open | $275,000 | VA | |
| Previous Owner | $69,300 | No Value Available |
| Date | Event | Price | List to Sale | Price per Sq Ft |
|---|---|---|---|---|
| 01/15/2026 01/15/26 | Sold | $275,000 | -5.2% | $159 / Sq Ft |
| 12/03/2025 12/03/25 | Price Changed | $290,000 | -3.3% | $168 / Sq Ft |
| 11/10/2025 11/10/25 | For Sale | $300,000 | -- | $174 / Sq Ft |
| Year | Tax Paid | Tax Assessment Tax Assessment Total Assessment is a certain percentage of the fair market value that is determined by local assessors to be the total taxable value of land and additions on the property. | Land | Improvement |
|---|---|---|---|---|
| 2025 | $996 | $19,781 | -- | -- |
| 2024 | $966 | $17,098 | -- | -- |
| 2023 | $966 | $17,098 | $0 | $0 |
| 2022 | $950 | $16,416 | $0 | $0 |
| 2021 | $981 | $16,416 | $0 | $0 |
| 2020 | $923 | $16,017 | $0 | $0 |
| 2019 | $918 | $16,017 | $0 | $0 |
| 2018 | $1,389 | $13,133 | $0 | $0 |
| 2017 | $1,208 | $13,133 | $0 | $0 |
| 2016 | $898 | $9,560 | $0 | $0 |
| 2015 | $867 | $9,560 | $0 | $0 |
| 2014 | -- | $5,230 | $0 | $0 |
| 2013 | -- | $7,220 | $0 | $0 |
Seller's Agent in 2026
Leo Rowen
RE/MAX
(303) 521-0360
1 in this area
398 Total Sales
Buyer's Agent in 2026
Jesse Davis
West and Main Homes
(303) 895-8536
2 in this area
70 Total Sales
Source: REcolorado®
MLS Number: 3852542
APN: 1973-11-4-08-022
Disclaimer: Certain information contained herein is derived from information provided by parties other than Homes.com. All information provided is deemed reliable, but is not guaranteed to be accurate and should be independently verified.
![]() Based on information submitted to the MLS GRID. All data is obtained from various sources and may not have been verified by broker or MLS GRID. Supplied Open House Information is subject to change without notice. All information should be independently reviewed and verified for accuracy. Properties may or may not be listed by the office/agent presenting the information. Some IDX listings have been excluded from this website. The content relating to real estate for sale in this Web site comes in part from the Internet Data eXchange (“IDX”) program of METROLIST, INC., DBA RECOLORADO®. Real estate listings held by brokers other than Ten-X are marked with the IDX Logo. This information is being provided for the consumers’ personal, non-commercial use and may not be used for any other purpose. All information is subject to change and should be independently verified.
Based on information submitted to the MLS GRID. All data is obtained from various sources and may not have been verified by broker or MLS GRID. Supplied Open House Information is subject to change without notice. All information should be independently reviewed and verified for accuracy. Properties may or may not be listed by the office/agent presenting the information. Some IDX listings have been excluded from this website. The content relating to real estate for sale in this Web site comes in part from the Internet Data eXchange (“IDX”) program of METROLIST, INC., DBA RECOLORADO®. Real estate listings held by brokers other than Ten-X are marked with the IDX Logo. This information is being provided for the consumers’ personal, non-commercial use and may not be used for any other purpose. All information is subject to change and should be independently verified.
This publication is designed to provide information with regard to the subject matter covered. It is displayed with the understanding that the publisher and authors are not engaged in rendering real estate, legal, accounting, tax, or other professional services and that the publisher and authors are not offering such advice in this publication. If real estate, legal, or other expert assistance is required, the services of a competent, professional person should be sought.
The information contained in this publication is subject to change without notice. METROLIST, INC., DBA RECOLORADO MAKES NO WARRANTY OF ANY KIND WITH REGARD TO THIS MATERIAL, INCLUDING, BUT NOT LIMITED TO, THE IMPLIED WARRANTIES OF MERCHANTABILITY AND FITNESS FOR A PARTICULAR PURPOSE. METROLIST, INC., DBA RECOLORADO SHALL NOT BE LIABLE FOR ERRORS CONTAINED HEREIN OR FOR ANY DAMAGES IN CONNECTION WITH THE FURNISHING, PERFORMANCE, OR USE OF THIS MATERIAL.
PUBLISHER’S NOTICE: All real estate advertised herein is subject to the Federal Fair Housing Act and the Colorado Fair Housing Act, which Acts make it illegal to make or publish any advertisement that indicates any preference, limitation, or discrimination based on race, color, religion, sex, handicap, familial status, or national origin.
METROLIST, INC., DBA RECOLORADO will not knowingly accept any advertising for real estate that is in violation of the law. All persons are hereby informed that all dwellings advertised are available on an equal opportunity basis.
© 2026 METROLIST, INC., DBA RECOLORADO® – All Rights Reserved. 6455 S. Yosemite St., Suite 500 Greenwood Village, CO 80111 USA
ALL RIGHTS RESERVED WORLDWIDE. No part of this publication may be reproduced, adapted, translated, stored in a retrieval system or transmitted in any form or by any means, electronic, mechanical, photocopying, recording, or otherwise, without the prior written permission of the publisher. The information contained herein including but not limited to all text, photographs, digital images, virtual tours, may be seeded and monitored for protection and tracking.
Based on information submitted to the MLS GRID
Ask me questions while you tour the home.