1161 E 9th St Chico, CA 95928
Chapman NeighborhoodEstimated Value: $252,000 - $318,000
About This Home
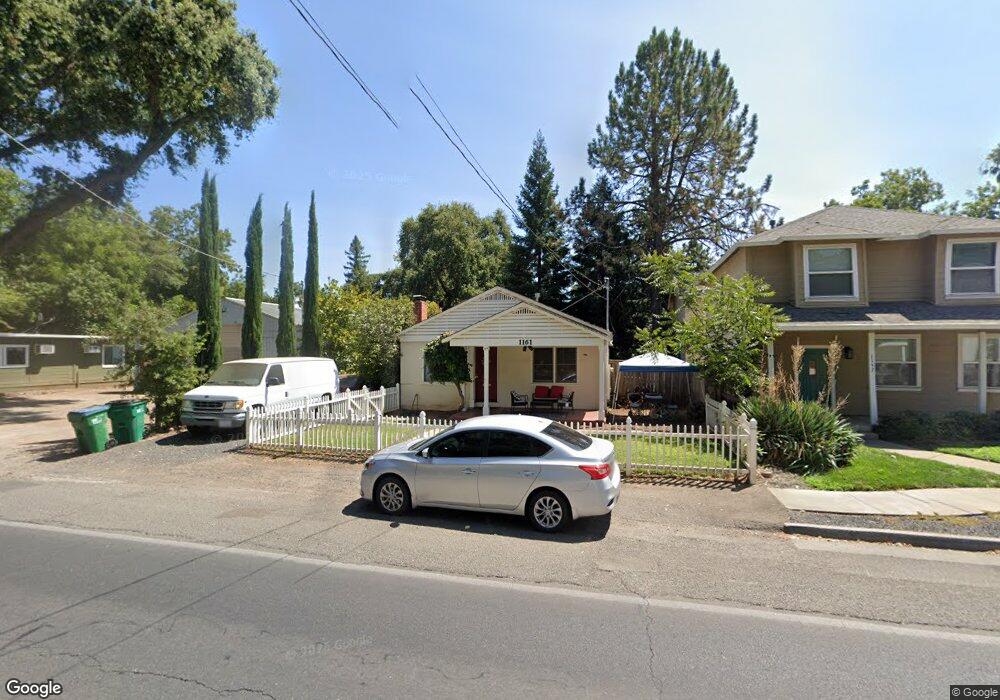
This home is located at 1161 E 9th St, Chico, CA 95928 and is currently estimated at $279,575, approximately $282 per square foot. 1161 E 9th St is a home located in Butte County with nearby schools including Parkview Elementary School, Chico Junior High School, and Chico High School.
Ownership History
We collect this data history from publicly available records. To have your information removed, we recommend requesting removal directly through your county’s website.
Purchase Details
Home Financials for this Owner
Home Financials are based on the most recent Mortgage that was taken out on this home.Purchase Details
Purchase Details
Home Values in the Area
Average Home Value in this Area
Purchase History
We collect this data history from publicly available records. To have your information removed, we recommend requesting removal directly through your county’s website.
| Date | Buyer | Sale Price | Title Company |
|---|---|---|---|
| $90,000 | Fidelity National Title | ||
| -- | -- | ||
| -- | -- |
Mortgage History
We collect this data history from publicly available records. To have your information removed, we recommend requesting removal directly through your county’s website.
| Date | Status | Borrower | Loan Amount |
|---|---|---|---|
| Open | $67,500 |
Tax History
We collect this data history from publicly available records. To have your information removed, we recommend requesting removal directly through your county’s website.
| Year | Tax Paid | Tax Assessment Tax Assessment Total Assessment is a certain percentage of the fair market value that is determined by local assessors to be the total taxable value of land and additions on the property. | Land | Improvement |
|---|---|---|---|---|
| 2025 | $1,458 | $132,932 | $66,466 | $66,466 |
| 2024 | $1,458 | $130,326 | $65,163 | $65,163 |
| 2023 | $1,441 | $127,772 | $63,886 | $63,886 |
| 2022 | $1,417 | $125,268 | $62,634 | $62,634 |
| 2021 | $1,390 | $122,812 | $61,406 | $61,406 |
| 2020 | $1,386 | $121,554 | $60,777 | $60,777 |
| 2019 | $1,362 | $119,172 | $59,586 | $59,586 |
| 2018 | $1,335 | $116,836 | $58,418 | $58,418 |
| 2017 | $1,308 | $114,546 | $57,273 | $57,273 |
| 2016 | $1,196 | $112,300 | $56,150 | $56,150 |
| 2015 | $1,195 | $110,614 | $55,307 | $55,307 |
| 2014 | $1,181 | $108,448 | $54,224 | $54,224 |
Map
- 1022 Linden St
- 1163 E 8th St
- 1178 E 8th St
- 1253 Woodland Ave
- 1095 Woodland Ave
- 1368 E 9th St
- 765 Humboldt Ave
- 754 E 8th St
- 667 E 8th St
- 578 E 7th St
- 555 Vallombrosa Ave Unit 86
- 1193 Olive St
- 0 California 32
- 1761 Elm St
- 897 Filbert Ave
- 740 Orient St
- 997 E 16th St
- 587 E 3rd St
- 1058 Stevie Joe Way
- 0 Fair St Unit SN25230897
- 1133 Buckwheat Way
- 1164 E 10th St
- 1158 E 10th St
- 1166 E 10th St
- 1167 E 9th St
- 1170 E 10th St
- 1161 E 10th St
- 1165 E 10th St
- 1179 E 9th St
- 1153 E 9th St
- 1171 E 10th St
- 1187 E 9th St
- 1184 E 10th St
- 1151 E 10th St
- 1191 E 9th St
- 1183 E 10th St Unit 9
- 1183 E 10th St
- 1151 E 9th St
- 1186 E 10th St
- 1185 E 10th St
Ask me questions while you tour the home.