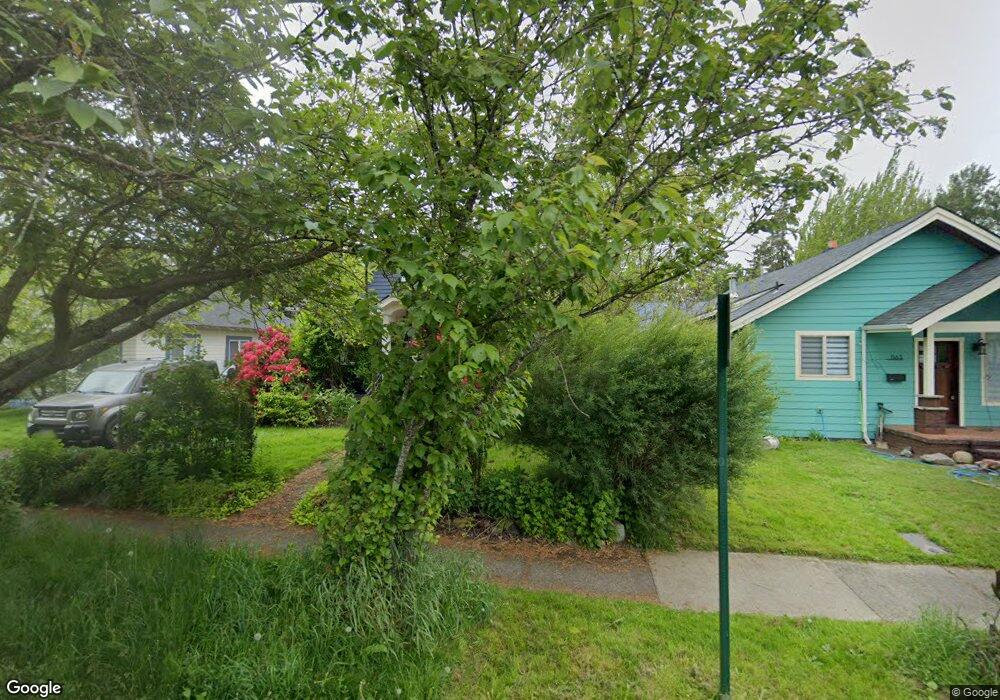
1161 Grant St Bellingham, WA 98225
York NeighborhoodEstimated Value: $578,000 - $627,276
3
Beds
1
Bath
1,090
Sq Ft
$546/Sq Ft
Est. Value
About This Home
This home is located at 1161 Grant St, Bellingham, WA 98225 and is currently estimated at $594,819, approximately $545 per square foot. 1161 Grant St is a home located in Whatcom County with nearby schools including Happy Valley Elementary School, Fairhaven Middle School, and Sehome High School.
Ownership History
Date
Name
Owned For
Owner Type
Purchase Details
Closed on
Aug 30, 2017
Sold by
Carlson Danielle M
Bought by
Luthi Thomas M and Opel Mallory
Current Estimated Value
Home Financials for this Owner
Home Financials are based on the most recent Mortgage that was taken out on this home.
Original Mortgage
$323,980
Outstanding Balance
$270,692
Interest Rate
3.92%
Mortgage Type
New Conventional
Estimated Equity
$324,127
Purchase Details
Closed on
Aug 19, 2013
Sold by
Kaynor Peter K and Sterken Katharine A
Bought by
Carlson Danielle M
Home Financials for this Owner
Home Financials are based on the most recent Mortgage that was taken out on this home.
Original Mortgage
$172,000
Interest Rate
4.33%
Mortgage Type
New Conventional
Purchase Details
Closed on
Feb 12, 2008
Sold by
Johnson Vicki Rowe
Bought by
Kaynor Peter K and Sterken Katharine A
Home Financials for this Owner
Home Financials are based on the most recent Mortgage that was taken out on this home.
Original Mortgage
$183,350
Interest Rate
6.04%
Mortgage Type
Purchase Money Mortgage
Create a Home Valuation Report for This Property
The Home Valuation Report is an in-depth analysis detailing your home's value as well as a comparison with similar homes in the area
Home Values in the Area
Average Home Value in this Area
Purchase History
| Date | Buyer | Sale Price | Title Company |
|---|---|---|---|
| Luthi Thomas M | $334,000 | Whatcom Land Title Co Inc | |
| Carlson Danielle M | $272,280 | Whatcom Land Title | |
| Kaynor Peter K | $193,330 | First American Title Insuran |
Source: Public Records
Mortgage History
| Date | Status | Borrower | Loan Amount |
|---|---|---|---|
| Open | Luthi Thomas M | $323,980 | |
| Previous Owner | Carlson Danielle M | $172,000 | |
| Previous Owner | Kaynor Peter K | $183,350 |
Source: Public Records
Tax History Compared to Growth
Tax History
| Year | Tax Paid | Tax Assessment Tax Assessment Total Assessment is a certain percentage of the fair market value that is determined by local assessors to be the total taxable value of land and additions on the property. | Land | Improvement |
|---|---|---|---|---|
| 2024 | $4,852 | $607,904 | $270,419 | $337,485 |
| 2023 | $4,852 | $623,381 | $277,304 | $346,077 |
| 2022 | $3,834 | $528,299 | $235,008 | $293,291 |
| 2021 | $3,761 | $412,734 | $183,600 | $229,134 |
| 2020 | $3,238 | $382,161 | $170,000 | $212,161 |
| 2019 | $3,050 | $318,011 | $140,600 | $177,411 |
| 2018 | $3,073 | $300,362 | $132,867 | $167,495 |
| 2017 | $2,676 | $258,704 | $114,190 | $144,514 |
| 2016 | $2,392 | $235,425 | $103,835 | $131,590 |
| 2015 | $2,398 | $219,078 | $97,945 | $121,133 |
| 2014 | -- | $212,491 | $95,000 | $117,491 |
| 2013 | -- | $174,851 | $88,500 | $86,351 |
Source: Public Records
Map
Nearby Homes
- 1234 Grant St
- 1205 E Maple St
- 1309 Billy Frank Jr St
- 1200 Lincoln St Unit 196
- 1200 Lincoln St Unit 117
- 1200 Lincoln St Unit 154
- 615 E Myrtle St
- 1126 N Forest St
- 616 E Myrtle St
- 5 XX Gladstone St
- 1470 James St
- 910 Gladstone St Unit 205
- 1356 Orleans St
- 1031 N State St Unit 107
- 1031 N State St Unit 209
- 1001 N State St Unit 403
- 901 N Forest St Unit 107
- 901 N Forest St Unit 125
- 901 N Forest St Unit 109
- 1227 Puget St