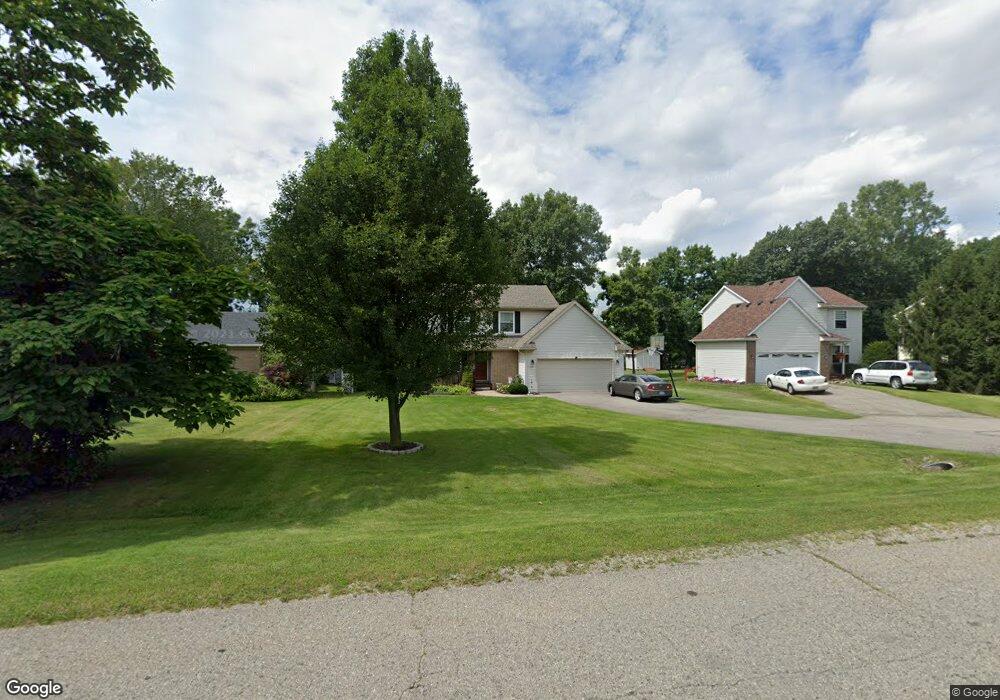
1161 Oakcrest Rd Unit 4 Howell, MI 48843
Estimated Value: $344,981 - $358,000
3
Beds
2
Baths
1,352
Sq Ft
$261/Sq Ft
Est. Value
About This Home
This home is located at 1161 Oakcrest Rd Unit 4, Howell, MI 48843 and is currently estimated at $352,745, approximately $260 per square foot. 1161 Oakcrest Rd Unit 4 is a home located in Livingston County with nearby schools including Northwest Elementary School, Highlander Way Middle School, and Howell High School.
Ownership History
Date
Name
Owned For
Owner Type
Purchase Details
Closed on
Aug 19, 2024
Sold by
Dingman Matthew A and Dingman Michelle D
Bought by
Dingman Matthew A and Dingman Michelle D
Current Estimated Value
Purchase Details
Closed on
Dec 2, 2002
Sold by
Jarzabek Joseph A and Duguay Jarzabek Beth Grace
Bought by
Dingman Matthew A and Dingman Michelle D
Home Financials for this Owner
Home Financials are based on the most recent Mortgage that was taken out on this home.
Original Mortgage
$179,500
Interest Rate
6.01%
Purchase Details
Closed on
Aug 25, 1995
Sold by
Reed & Mcclellan Builder
Bought by
Beth Joseph A
Home Financials for this Owner
Home Financials are based on the most recent Mortgage that was taken out on this home.
Original Mortgage
$118,500
Interest Rate
7.55%
Mortgage Type
New Conventional
Create a Home Valuation Report for This Property
The Home Valuation Report is an in-depth analysis detailing your home's value as well as a comparison with similar homes in the area
Home Values in the Area
Average Home Value in this Area
Purchase History
| Date | Buyer | Sale Price | Title Company |
|---|---|---|---|
| Dingman Matthew A | -- | None Listed On Document | |
| Dingman Matthew A | $189,000 | American Title Co Of Livings | |
| Beth Joseph A | $124,800 | -- |
Source: Public Records
Mortgage History
| Date | Status | Borrower | Loan Amount |
|---|---|---|---|
| Previous Owner | Dingman Matthew A | $179,500 | |
| Previous Owner | Beth Joseph A | $118,500 |
Source: Public Records
Tax History Compared to Growth
Tax History
| Year | Tax Paid | Tax Assessment Tax Assessment Total Assessment is a certain percentage of the fair market value that is determined by local assessors to be the total taxable value of land and additions on the property. | Land | Improvement |
|---|---|---|---|---|
| 2025 | $1,311 | $140,700 | $0 | $0 |
| 2024 | $1,274 | $134,600 | $0 | $0 |
| 2023 | $1,217 | $115,800 | $0 | $0 |
| 2022 | $560 | $97,100 | $0 | $0 |
| 2021 | $1,686 | $103,000 | $0 | $0 |
| 2020 | $1,705 | $97,100 | $0 | $0 |
| 2019 | $1,681 | $94,100 | $0 | $0 |
| 2018 | $1,660 | $91,300 | $0 | $0 |
| 2017 | $1,638 | $86,300 | $0 | $0 |
| 2016 | $1,629 | $76,000 | $0 | $0 |
| 2014 | $1,788 | $67,300 | $0 | $0 |
| 2012 | $1,788 | $63,400 | $0 | $0 |
Source: Public Records
Map
Nearby Homes
- 1400 Oakcrest Rd
- VACANT LOT Thompson Shore Dr
- 1570 Princewood Blvd
- 1633 Frech Ln
- 2653 Ravine Side N
- 2511 Kerria Dr Unit 42
- 2700 Court Ln N
- 3224 Waverly Woods Ln
- 3227 Waverly Woods Ln
- 3040 Bogues View Dr
- 3020 Brookline
- 330 Harvard Dr
- 571 Cannonade Loop
- 523 Cannonade Loop
- 583 Cannonade Loop
- 475 Cannonade Loop
- Vac Harvard Dr
- 559 Cannonade Loop
- 275 Harvard Dr
- The Austin Plan at Broadmoor
- 1173 Oakcrest Rd
- 1147 Oakcrest Rd Unit 5
- 1187 Oakcrest Rd Unit 2
- 1135 Oakcrest Rd
- 0 Oakcrest Unit 5613076
- 0 Oakcrest Unit 630000036775
- 0 Oakcrest Unit 36775
- 0 Oakcrest Rd
- 0 Oakcrest Unit 36775
- VL Oak Crest #3
- VL Oak Crest #2
- 2483 Livingston Ave
- 2496 Eads Place
- 1201 Oakcrest Rd Unit 1
- 1123 Oakcrest Rd
- 2484 Livingston Ave
- 2475 Livingston Ave
- 2488 Eads Place
- 2551 Castle Rock Ct Unit 19
- 2472 Livingston Ave