Estimated Value: $251,086 - $278,000
3
Beds
1
Bath
1,240
Sq Ft
$214/Sq Ft
Est. Value
About This Home
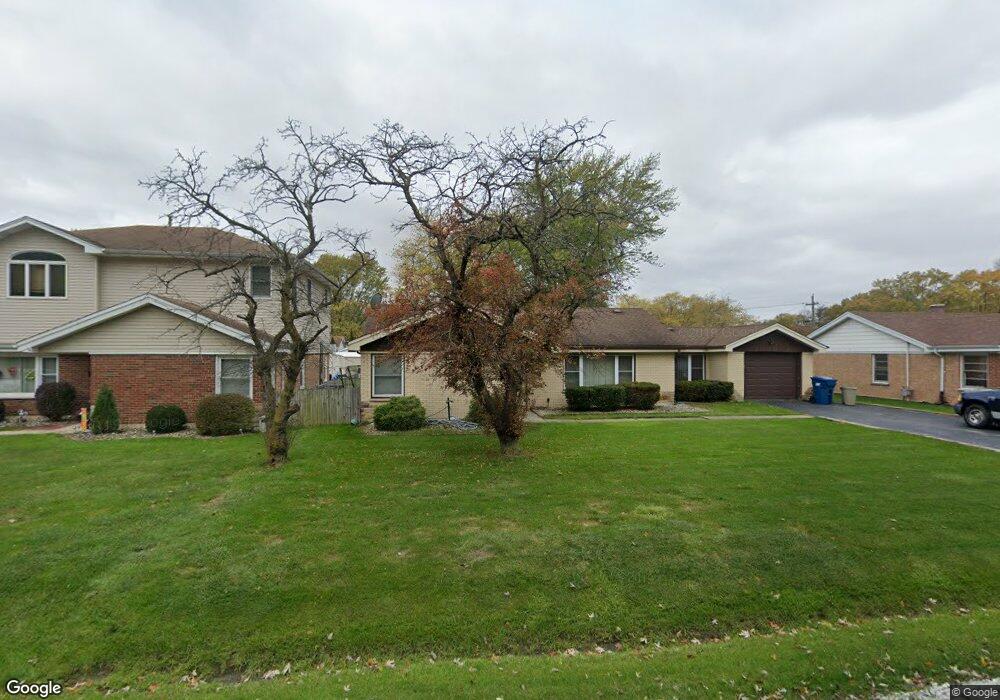
This home is located at 11612 S Nagle Ave, Worth, IL 60482 and is currently estimated at $264,772, approximately $213 per square foot. 11612 S Nagle Ave is a home located in Cook County with nearby schools including Worth Elementary School, Worth Jr High School, and A B Shepard High School.
Ownership History
Date
Name
Owned For
Owner Type
Purchase Details
Closed on
Oct 21, 2020
Sold by
Konow Charles W and Petrik Christine L
Bought by
Konow Charles W
Current Estimated Value
Home Financials for this Owner
Home Financials are based on the most recent Mortgage that was taken out on this home.
Original Mortgage
$171,000
Interest Rate
4.16%
Mortgage Type
VA
Purchase Details
Closed on
May 20, 2014
Sold by
Konow Charles W and Petrik Christine L
Bought by
Konow Charles W and Petrik Christine L
Home Financials for this Owner
Home Financials are based on the most recent Mortgage that was taken out on this home.
Original Mortgage
$71,500
Interest Rate
3.75%
Mortgage Type
New Conventional
Purchase Details
Closed on
Feb 19, 2003
Sold by
Founders Bank
Bought by
Konow Charles W and Petrik Konow Christine L
Home Financials for this Owner
Home Financials are based on the most recent Mortgage that was taken out on this home.
Original Mortgage
$98,400
Interest Rate
6.02%
Mortgage Type
Unknown
Create a Home Valuation Report for This Property
The Home Valuation Report is an in-depth analysis detailing your home's value as well as a comparison with similar homes in the area
Home Values in the Area
Average Home Value in this Area
Purchase History
| Date | Buyer | Sale Price | Title Company |
|---|---|---|---|
| Konow Charles W | $15,000 | Amrock | |
| Konow Charles W | -- | Attorney | |
| Konow Charles W | $100,000 | Ticor Title | |
| Konow Charles W | $100,000 | Ticor Title |
Source: Public Records
Mortgage History
| Date | Status | Borrower | Loan Amount |
|---|---|---|---|
| Previous Owner | Konow Charles W | $171,000 | |
| Previous Owner | Konow Charles W | $71,500 | |
| Previous Owner | Konow Charles W | $98,400 |
Source: Public Records
Tax History Compared to Growth
Tax History
| Year | Tax Paid | Tax Assessment Tax Assessment Total Assessment is a certain percentage of the fair market value that is determined by local assessors to be the total taxable value of land and additions on the property. | Land | Improvement |
|---|---|---|---|---|
| 2024 | $1,428 | $17,000 | $5,895 | $11,105 |
| 2023 | $2,457 | $17,000 | $5,895 | $11,105 |
| 2022 | $2,457 | $16,589 | $5,158 | $11,431 |
| 2021 | $2,302 | $16,589 | $5,158 | $11,431 |
| 2020 | $2,096 | $16,589 | $5,158 | $11,431 |
| 2019 | $2,451 | $16,124 | $4,666 | $11,458 |
| 2018 | $2,445 | $16,124 | $4,666 | $11,458 |
| 2017 | $2,401 | $16,124 | $4,666 | $11,458 |
| 2016 | $3,676 | $13,127 | $3,930 | $9,197 |
| 2015 | $3,791 | $13,127 | $3,930 | $9,197 |
| 2014 | $4,547 | $13,127 | $3,930 | $9,197 |
| 2013 | $4,157 | $13,342 | $3,930 | $9,412 |
Source: Public Records
Map
Nearby Homes
- 11554 S Neenah Ave
- 11512 S Nagle Ave
- 11400 S Ridgeland Ave
- 6710 W 115th St
- 11524 S Ridgeland Ave
- 11258 S Normandy Ave
- 6532 W 112th St
- 6545 W 111th St
- 11109 S Normandy Ave
- 12246 S Nagle Ave
- 12256 S Arbor Trail Unit 11W
- 7112 W 114th Place
- 7117 W 113th Place
- 6040 111th St
- 6737 W Lloyd Dr
- 10931 S Lloyd Dr Unit 1B
- 10910 S Natchez Ave
- 6856 W Crandall Ave
- 10937 Moody Ave
- 11024 Mason Ave
- 11618 S Nagle Ave
- 11613 S Natchez Ave
- 11600 S Nagle Ave
- 11619 S Natchez Ave
- 11624 S Nagle Ave
- 11607 S Natchez Ave
- 11613 S Nagle Ave
- 11601 S Natchez Ave
- 11625 S Natchez Ave
- 11607 S Nagle Ave
- 11619 S Nagle Ave
- 11630 S Nagle Ave
- 11601 S Nagle Ave
- 11631 S Natchez Ave
- 11566 S Nagle Ave
- 11631 S Nagle Ave
- 11636 S Nagle Ave
- 11567 S Natchez Ave
- 11612 S Ridgeland Ave
- 11612 S Natchez Ave