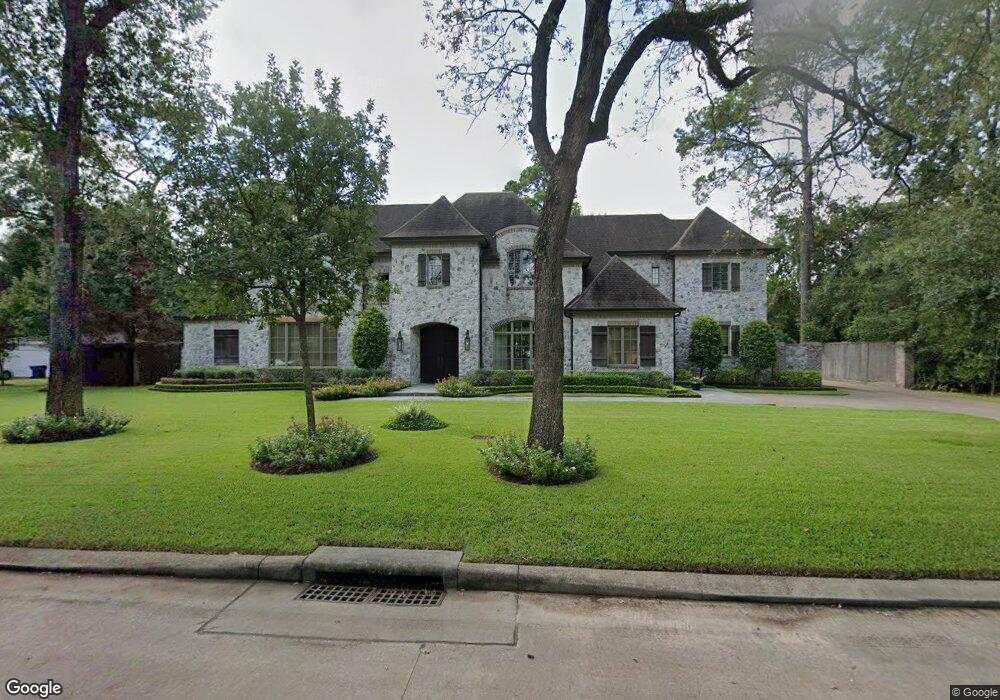
11613 Blalock Forest St Houston, TX 77024
Estimated Value: $2,397,000 - $3,719,000
5
Beds
3
Baths
3,000
Sq Ft
$1,044/Sq Ft
Est. Value
About This Home
This home is located at 11613 Blalock Forest St, Houston, TX 77024 and is currently estimated at $3,132,515, approximately $1,044 per square foot. 11613 Blalock Forest St is a home located in Harris County with nearby schools including Memorial Drive Elementary School, Spring Branch Middle School, and Memorial High School.
Ownership History
Date
Name
Owned For
Owner Type
Purchase Details
Closed on
Jul 15, 2024
Sold by
Cecil James David and Cecil Karen Elisa
Bought by
Vu Thuan T and Le Anne T
Current Estimated Value
Purchase Details
Closed on
Oct 18, 2010
Sold by
Pinckney Robert H and Pinckney Patricia R
Bought by
Cecil James David and Cecil Karen Elisa
Home Financials for this Owner
Home Financials are based on the most recent Mortgage that was taken out on this home.
Original Mortgage
$580,000
Interest Rate
4.38%
Mortgage Type
Purchase Money Mortgage
Purchase Details
Closed on
Oct 1, 1998
Sold by
Wigginton Jeffrey C and Wigginton Mary W
Bought by
Pinckney Robert H and Pinckney Patricia R
Home Financials for this Owner
Home Financials are based on the most recent Mortgage that was taken out on this home.
Original Mortgage
$387,000
Interest Rate
6.92%
Create a Home Valuation Report for This Property
The Home Valuation Report is an in-depth analysis detailing your home's value as well as a comparison with similar homes in the area
Home Values in the Area
Average Home Value in this Area
Purchase History
| Date | Buyer | Sale Price | Title Company |
|---|---|---|---|
| Vu Thuan T | -- | None Listed On Document | |
| Cecil James David | -- | Chicago Title Insurance Co | |
| Pinckney Robert H | -- | Charter Title Company |
Source: Public Records
Mortgage History
| Date | Status | Borrower | Loan Amount |
|---|---|---|---|
| Previous Owner | Cecil James David | $580,000 | |
| Previous Owner | Pinckney Robert H | $387,000 |
Source: Public Records
Tax History Compared to Growth
Tax History
| Year | Tax Paid | Tax Assessment Tax Assessment Total Assessment is a certain percentage of the fair market value that is determined by local assessors to be the total taxable value of land and additions on the property. | Land | Improvement |
|---|---|---|---|---|
| 2025 | $39,797 | $3,080,571 | $1,252,500 | $1,828,071 |
| 2024 | $39,797 | $2,524,495 | $1,210,750 | $1,313,745 |
| 2023 | $39,797 | $2,767,475 | $1,148,125 | $1,619,350 |
| 2022 | $57,180 | $3,003,128 | $1,148,125 | $1,855,003 |
| 2021 | $56,967 | $2,630,500 | $1,085,500 | $1,545,000 |
| 2020 | $54,505 | $2,461,089 | $1,085,500 | $1,375,589 |
| 2019 | $60,496 | $2,622,635 | $1,085,500 | $1,537,135 |
| 2018 | $13,862 | $2,727,972 | $1,085,500 | $1,642,472 |
| 2017 | $62,926 | $2,727,972 | $1,085,500 | $1,642,472 |
| 2016 | $62,926 | $2,727,972 | $1,085,500 | $1,642,472 |
| 2015 | $58,473 | $2,727,972 | $1,085,500 | $1,642,472 |
| 2014 | $58,473 | $2,527,647 | $939,375 | $1,588,272 |
Source: Public Records
Map
Nearby Homes
- 11606 Blalock Ln
- 11722 Claywood St
- 11640 Greenbay St
- 11711 Memorial Dr Unit 570
- 11711 Memorial Dr Unit 55
- 11711 Memorial Dr Unit 21
- 11711 Memorial Dr Unit 565
- 11711 Memorial Dr Unit 695
- 11711 Memorial Dr Unit 644
- 11711 Memorial Dr Unit 285
- 11711 Memorial Dr Unit 371
- 11711 Memorial Dr Unit 129
- 11711 Memorial Dr Unit 251
- 11711 Memorial Dr Unit 573
- 11711 Memorial Dr Unit 545
- 11711 Memorial Dr Unit 276
- 11711 Memorial Dr Unit 13
- 11711 Memorial Dr Unit 367
- 1 Chuckanut Ln
- 247 Piney Point Rd
- 11613 Blalock Forest St
- 11609 Blalock Forest St
- 11617 Blalock Forest St
- 11614 Blalock Forest St
- 11614 Green Oaks St
- 11610 Green Oaks St
- 11610 Blalock Forest St
- 11618 Green Oaks St
- 11606 Green Oaks St
- 11215 Blalock Forest
- 11601 Blalock Forest St
- 11620 Blalock Forest St
- 11621 Blalock Forest St
- 11622 Green Oaks St
- 11602 Green Oaks St
- 11611 Habersham Ln
- 11602 Blalock Forest St
- 11607 Habersham Ln
- 11615 Habersham Ln
- 11626 Blalock Forest