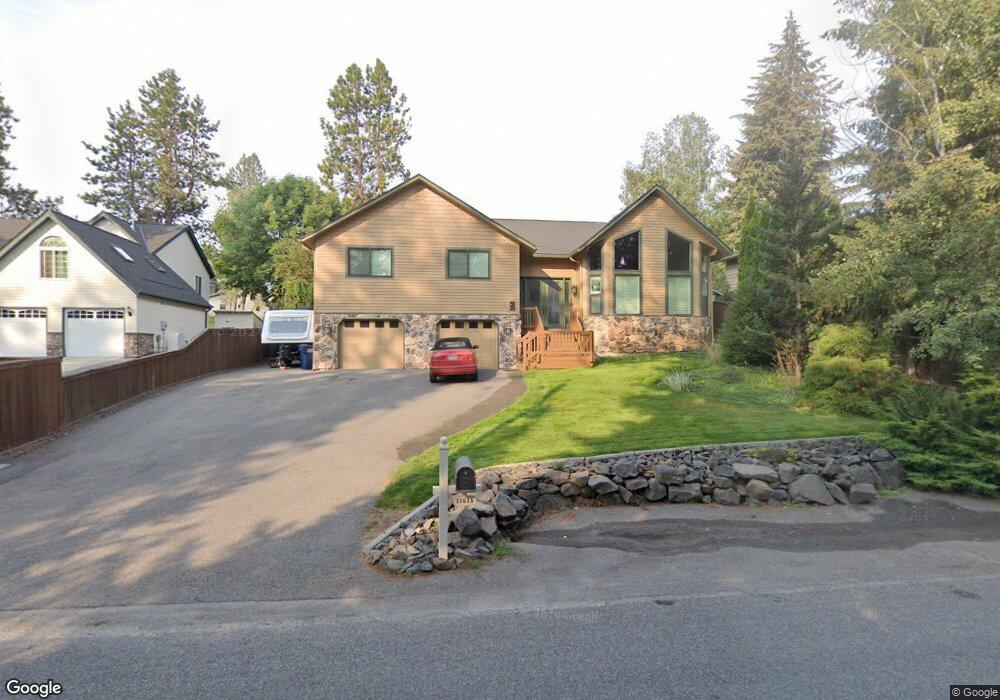
11613 N Avondale Loop Hayden, ID 83835
Avondale on Hayden NeighborhoodEstimated Value: $745,290 - $766,000
4
Beds
3
Baths
2,220
Sq Ft
$339/Sq Ft
Est. Value
About This Home
This home is located at 11613 N Avondale Loop, Hayden, ID 83835 and is currently estimated at $753,323, approximately $339 per square foot. 11613 N Avondale Loop is a home located in Kootenai County with nearby schools including Hayden Meadows Elementary School, Canfield Middle School, and Coeur d'Alene High School.
Ownership History
Date
Name
Owned For
Owner Type
Purchase Details
Closed on
Oct 15, 2019
Sold by
Woodbury Lowell A and Woodbury Barbara M
Bought by
Rutzen Ray and Rutzen Karen
Current Estimated Value
Home Financials for this Owner
Home Financials are based on the most recent Mortgage that was taken out on this home.
Original Mortgage
$403,750
Outstanding Balance
$352,187
Interest Rate
3.4%
Mortgage Type
New Conventional
Estimated Equity
$401,136
Purchase Details
Closed on
Jun 2, 2015
Sold by
Woodbury Lowell A and Woodbury Barbara Mercer
Bought by
Woodbury Family Living Trust
Purchase Details
Closed on
Oct 5, 2011
Sold by
Stueve Robert M and Stueve Kristin
Bought by
Woodbury Lowell Angus and Woodbury Barbara Mercer
Home Financials for this Owner
Home Financials are based on the most recent Mortgage that was taken out on this home.
Original Mortgage
$212,800
Interest Rate
4.16%
Mortgage Type
New Conventional
Create a Home Valuation Report for This Property
The Home Valuation Report is an in-depth analysis detailing your home's value as well as a comparison with similar homes in the area
Home Values in the Area
Average Home Value in this Area
Purchase History
| Date | Buyer | Sale Price | Title Company |
|---|---|---|---|
| Rutzen Ray | -- | North American Title Company | |
| Woodbury Family Living Trust | -- | None Available | |
| Woodbury Lowell Angus | -- | -- |
Source: Public Records
Mortgage History
| Date | Status | Borrower | Loan Amount |
|---|---|---|---|
| Open | Rutzen Ray | $403,750 | |
| Previous Owner | Woodbury Lowell Angus | $212,800 |
Source: Public Records
Tax History
| Year | Tax Paid | Tax Assessment Tax Assessment Total Assessment is a certain percentage of the fair market value that is determined by local assessors to be the total taxable value of land and additions on the property. | Land | Improvement |
|---|---|---|---|---|
| 2025 | $2,221 | $680,972 | $270,000 | $410,972 |
| 2024 | $2,120 | $667,719 | $260,000 | $407,719 |
| 2023 | $2,120 | $718,855 | $275,000 | $443,855 |
| 2022 | $2,667 | $803,829 | $280,000 | $523,829 |
| 2021 | $3,038 | $476,326 | $165,000 | $311,326 |
| 2020 | $2,801 | $391,420 | $130,000 | $261,420 |
| 2019 | $2,177 | $376,700 | $130,000 | $246,700 |
| 2018 | $2,234 | $354,450 | $138,000 | $216,450 |
| 2017 | $2,159 | $329,180 | $120,000 | $209,180 |
| 2016 | $2,065 | $304,720 | $105,800 | $198,920 |
| 2015 | $2,088 | $297,100 | $92,000 | $205,100 |
| 2013 | -- | $243,910 | $51,750 | $192,160 |
Source: Public Records
Map
Nearby Homes
- 1997 E Avondale Ln
- 11459 N Trafalgar St
- 12331 N Avondale Loop
- 1560 E Bruin Loop
- 1404 E Bruin Loop
- 10637 N Friar Dr Unit 15
- 162483 N Lakeview Dr
- 10569 N Friar Dr Unit B
- 2918 E Point Hayden Dr
- 1055 E Maroon Creek Dr
- 1244 E Sleeping Deer Ave
- 1243 E Sleeping Deer Ave
- 1202 E Sleeping Deer Ave
- 3089 Lake Forest Dr
- 11907 N Blue Jay Ct
- 2992 E Lake Forest Dr
- 10280 N Pines Rd
- 12665 N Shamrock St
- 1389 E Ezra Ave
- 11042 N Cattle Dr
- 11583 N Avondale Loop
- 11643 N Avondale Loop
- 11563 N Avondale Loop
- 11561 N Avondale Loop
- 11651 N Avondale Loop
- 11555 N Avondale Loop
- 11574 N Avondale Loop
- 11459 N Avondale Loop
- 11962 N Avondale Loop
- LOT 50 N Avondale Loop
- 11958 N Avondale Loop
- 0 N Avondale Loop
- NNA N Avondale Loop
- 11560 N Avondale Loop
- 11648 N Avondale Loop
- 11679 N Avondale Loop
- 11527 N Avondale Loop
- 11528 N Avondale Loop
- 11662 N Avondale Loop
- 11495 N Avondale Loop
Your Personal Tour Guide
Ask me questions while you tour the home.