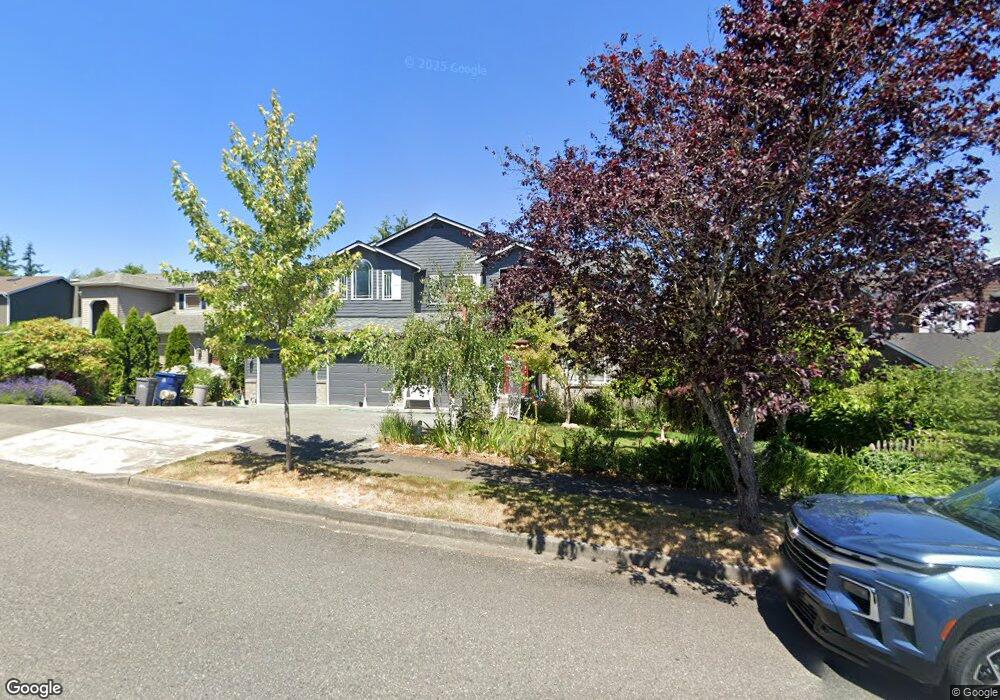
11617 33rd Ct NE Lake Stevens, WA 98258
Old Town Lake Stevens NeighborhoodEstimated Value: $867,780 - $942,000
5
Beds
3
Baths
3,200
Sq Ft
$280/Sq Ft
Est. Value
About This Home
This home is located at 11617 33rd Ct NE, Lake Stevens, WA 98258 and is currently estimated at $895,195, approximately $279 per square foot. 11617 33rd Ct NE is a home located in Snohomish County with nearby schools including Highland Elementary School, North Lake Middle School, and Cavelero Mid High School.
Ownership History
Date
Name
Owned For
Owner Type
Purchase Details
Closed on
Aug 2, 1999
Sold by
Marshall Rochelle and Heaps Rochelle Marshall
Bought by
Putnam Gregory C and Putnam Nancy M
Current Estimated Value
Home Financials for this Owner
Home Financials are based on the most recent Mortgage that was taken out on this home.
Original Mortgage
$198,700
Outstanding Balance
$57,055
Interest Rate
7.64%
Estimated Equity
$838,140
Purchase Details
Closed on
Jan 23, 1999
Sold by
Heaps W Russell
Bought by
Marshall Heaps Rochelle
Purchase Details
Closed on
Aug 6, 1996
Sold by
Beam Construction Inc
Bought by
Heaps W Russell and Marshall Heaps Rochelle
Home Financials for this Owner
Home Financials are based on the most recent Mortgage that was taken out on this home.
Original Mortgage
$169,000
Interest Rate
8.33%
Create a Home Valuation Report for This Property
The Home Valuation Report is an in-depth analysis detailing your home's value as well as a comparison with similar homes in the area
Home Values in the Area
Average Home Value in this Area
Purchase History
| Date | Buyer | Sale Price | Title Company |
|---|---|---|---|
| Putnam Gregory C | $264,950 | First American Title Ins Co | |
| Marshall Heaps Rochelle | -- | Commonwealth Land Title Ins | |
| Heaps W Russell | $211,950 | First American Title |
Source: Public Records
Mortgage History
| Date | Status | Borrower | Loan Amount |
|---|---|---|---|
| Open | Putnam Gregory C | $198,700 | |
| Previous Owner | Heaps W Russell | $169,000 |
Source: Public Records
Tax History Compared to Growth
Tax History
| Year | Tax Paid | Tax Assessment Tax Assessment Total Assessment is a certain percentage of the fair market value that is determined by local assessors to be the total taxable value of land and additions on the property. | Land | Improvement |
|---|---|---|---|---|
| 2025 | $7,389 | $872,600 | $353,000 | $519,600 |
| 2024 | $7,389 | $807,100 | $312,000 | $495,100 |
| 2023 | $7,061 | $835,400 | $323,000 | $512,400 |
| 2022 | $6,616 | $646,600 | $236,000 | $410,600 |
| 2020 | $6,197 | $567,300 | $200,000 | $367,300 |
| 2019 | $5,773 | $519,500 | $179,000 | $340,500 |
| 2018 | $5,724 | $470,800 | $153,000 | $317,800 |
| 2017 | $4,572 | $425,300 | $129,000 | $296,300 |
| 2016 | $4,572 | $395,500 | $116,000 | $279,500 |
| 2015 | $4,657 | $374,500 | $102,000 | $272,500 |
| 2013 | $3,773 | $265,100 | $85,000 | $180,100 |
Source: Public Records
Map
Nearby Homes
- 11608 34th St NE
- 11416 33rd St NE
- 11305 31st Place NE
- 3606 114th Ct NE
- 12101 30th St NE
- 12203 30th St NE
- 12611 37th Place NE
- 4317 121st Dr NE
- 10909 33rd Place NE
- 10825 32nd St NE
- 2311 116th Ave NE
- 2215 116th Ave NE
- 2515 Spruce Rd
- 2509 Spruce Rd
- 12104 22nd St NE
- 10309 35th St NE
- 12004 22nd St NE
- 2004 120th Ave SE
- 12829 27th Place NE
- 2427 Spruce Rd
- 11621 33rd Ct NE
- 11613 33rd Ct NE
- 11620 34th St NE
- 11616 34th St NE
- 11609 33rd Ct NE
- 11614 33rd Ct NE
- 11612 34th St NE
- 11618 33rd Ct NE
- 11610 33rd Ct NE
- 11605 33rd Ct NE
- 3309 117th Ave NE
- 3313 117th Ave NE
- 3305 117th Ave NE
- 11609 34th St NE
- 11602 33rd Ct NE
- 11701 34th St NE
- 11606 33rd Ct NE
- 3212 117th Ave NE
- 3219 117th Ave NE
- 11601 33rd Ct NE