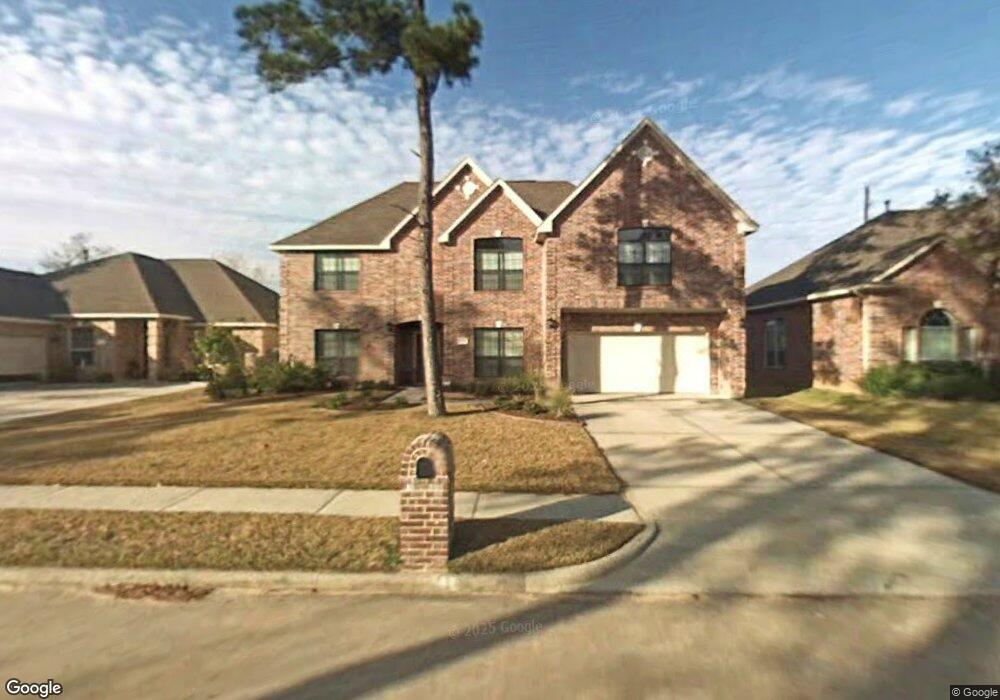
11618 Briar Canyon Ct Tomball, TX 77377
Estimated Value: $495,550 - $566,000
4
Beds
4
Baths
4,286
Sq Ft
$126/Sq Ft
Est. Value
About This Home
This home is located at 11618 Briar Canyon Ct, Tomball, TX 77377 and is currently estimated at $541,888, approximately $126 per square foot. 11618 Briar Canyon Ct is a home located in Harris County with nearby schools including Lakewood Elementary School, Willow Wood Junior High School, and Northpointe Intermediate School.
Ownership History
Date
Name
Owned For
Owner Type
Purchase Details
Closed on
Jun 17, 2010
Sold by
Dw Jw Investments Llc
Bought by
White Travis D
Current Estimated Value
Home Financials for this Owner
Home Financials are based on the most recent Mortgage that was taken out on this home.
Original Mortgage
$163,520
Outstanding Balance
$109,376
Interest Rate
4.93%
Mortgage Type
New Conventional
Estimated Equity
$432,512
Purchase Details
Closed on
Apr 9, 2010
Sold by
Wells Fargo Bank Na
Bought by
Dw Jw Investments Llc
Purchase Details
Closed on
Jul 7, 2009
Sold by
Knight Curvis L and Knight Deandra J
Bought by
Wells Fargo Bank Na
Purchase Details
Closed on
Aug 31, 2006
Sold by
Legacy Custom Homes Inc
Bought by
Knight Curvis L
Home Financials for this Owner
Home Financials are based on the most recent Mortgage that was taken out on this home.
Original Mortgage
$56,033
Interest Rate
6.64%
Mortgage Type
Stand Alone Second
Create a Home Valuation Report for This Property
The Home Valuation Report is an in-depth analysis detailing your home's value as well as a comparison with similar homes in the area
Home Values in the Area
Average Home Value in this Area
Purchase History
| Date | Buyer | Sale Price | Title Company |
|---|---|---|---|
| White Travis D | -- | Etc | |
| Dw Jw Investments Llc | -- | Lsi Title Agency Inc | |
| Wells Fargo Bank Na | $165,000 | None Available | |
| Knight Curvis L | -- | Guardian Fidelity Title | |
| Legacy Custom Homes Inc | -- | Guardian Fidelity Title |
Source: Public Records
Mortgage History
| Date | Status | Borrower | Loan Amount |
|---|---|---|---|
| Open | White Travis D | $163,520 | |
| Previous Owner | Knight Curvis L | $56,033 | |
| Previous Owner | Legacy Custom Homes Inc | $56,033 | |
| Previous Owner | Knight Curvis L | $224,133 |
Source: Public Records
Tax History Compared to Growth
Tax History
| Year | Tax Paid | Tax Assessment Tax Assessment Total Assessment is a certain percentage of the fair market value that is determined by local assessors to be the total taxable value of land and additions on the property. | Land | Improvement |
|---|---|---|---|---|
| 2025 | $8,714 | $535,594 | $71,552 | $464,042 |
| 2024 | $8,714 | $514,000 | $68,661 | $445,339 |
| 2023 | $8,714 | $526,800 | $61,795 | $465,005 |
| 2022 | $9,418 | $460,616 | $61,795 | $398,821 |
| 2021 | $9,033 | $383,581 | $43,365 | $340,216 |
| 2020 | $8,523 | $360,295 | $43,365 | $316,930 |
| 2019 | $7,957 | $352,729 | $41,558 | $311,171 |
| 2018 | $3,311 | $293,000 | $31,395 | $261,605 |
| 2017 | $6,565 | $293,000 | $31,395 | $261,605 |
| 2016 | $5,969 | $319,193 | $31,395 | $287,798 |
| 2015 | $4,882 | $204,400 | $31,395 | $173,005 |
| 2014 | $4,882 | $204,400 | $31,395 | $173,005 |
Source: Public Records
Map
Nearby Homes
- 11611 Teal Hollow Ln
- 11814 Lake Grove Ct
- 16855 E Maglitto Cir
- 16206 Lakewood Field Dr
- 11831 Gray Forest Trail
- 15915 Broad Oak Ct
- 11650 Brentcross Dr
- 16102 Buckhead Ct
- 11722 Gray Forest Trail
- 11719 Lakewood Crossing Dr
- 15903 Heron Trail
- 15726 Gettysburg Dr
- 16218 Jordyn Lake Dr
- 17311 Elverson Oaks Dr
- 11802 Laurel Meadow Dr
- 11815 Lakewood Hills Dr
- 16106 Limestone Lake Dr
- 15627 Gettysburg Dr
- 16107 Sweetwater Fields Ln Unit B1
- 16030 Summerville Lake Dr
- 11614 Briar Canyon Ct
- 11622 Briar Canyon Ct
- 11626 Briar Canyon Ct
- 11610 Briar Canyon Ct
- 11619 Briar Canyon Ct
- 11623 Briar Canyon Ct
- 11627 Briar Canyon Ct
- 11606 Briar Canyon Ct
- 11611 Briar Canyon Ct
- 11631 Briar Canyon Ct
- 11702 Briar Canyon Ct
- 11702 Briar Canyon Ct Unit 1
- 11602 Briar Canyon Ct
- 16219 Lakewood Grove Dr
- 16222 Chestnut Trail
- 11706 Briar Canyon Ct
- 11706 Briar Canyon Ct Unit 1
- 11707 Briar Canyon Ct
- 16218 Chestnut Trail
- 16215 Lakewood Grove Dr