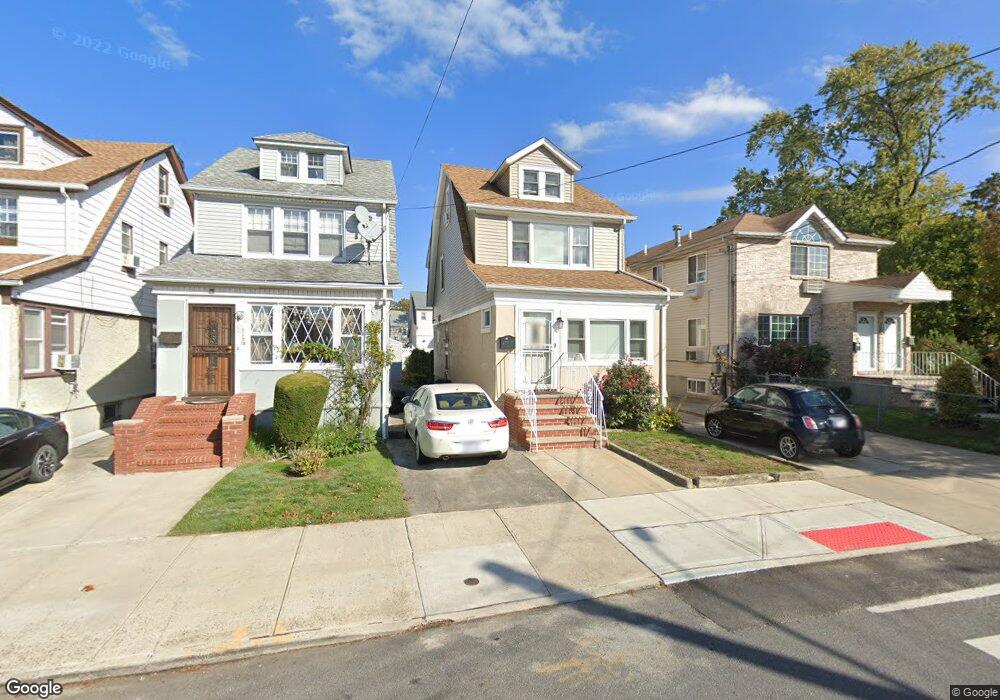
11619 196th St Saint Albans, NY 11412
Saint Albans NeighborhoodEstimated Value: $614,000 - $705,000
--
Bed
--
Bath
1,536
Sq Ft
$441/Sq Ft
Est. Value
About This Home
This home is located at 11619 196th St, Saint Albans, NY 11412 and is currently estimated at $677,317, approximately $440 per square foot. 11619 196th St is a home located in Queens County with nearby schools including P.S. 136 Roy Wilkins, I.S. 192 The Linden, and Riverton Street Charter School.
Ownership History
Date
Name
Owned For
Owner Type
Purchase Details
Closed on
Nov 22, 2024
Sold by
Malcolm Berta A and Wright Berta A
Bought by
Gordon Hillary and Gordon Rodney
Current Estimated Value
Home Financials for this Owner
Home Financials are based on the most recent Mortgage that was taken out on this home.
Original Mortgage
$649,900
Outstanding Balance
$643,925
Interest Rate
6.54%
Mortgage Type
Purchase Money Mortgage
Estimated Equity
$33,392
Purchase Details
Closed on
Mar 24, 1998
Sold by
Bettere Homes Depot Inc
Bought by
Malcolm Berta A
Home Financials for this Owner
Home Financials are based on the most recent Mortgage that was taken out on this home.
Original Mortgage
$171,626
Interest Rate
7.05%
Mortgage Type
FHA
Purchase Details
Closed on
Dec 11, 1997
Sold by
Taylor Dorothy Schenck
Bought by
Better Homes Depot Inc
Create a Home Valuation Report for This Property
The Home Valuation Report is an in-depth analysis detailing your home's value as well as a comparison with similar homes in the area
Home Values in the Area
Average Home Value in this Area
Purchase History
| Date | Buyer | Sale Price | Title Company |
|---|---|---|---|
| Gordon Hillary | $670,000 | -- | |
| Malcolm Berta A | $179,000 | Chicago Title Insurance Co | |
| Malcolm Berta A | $179,000 | Chicago Title Insurance Co | |
| Better Homes Depot Inc | $125,000 | -- | |
| Better Homes Depot Inc | $125,000 | -- |
Source: Public Records
Mortgage History
| Date | Status | Borrower | Loan Amount |
|---|---|---|---|
| Open | Gordon Hillary | $649,900 | |
| Previous Owner | Malcolm Berta A | $171,626 |
Source: Public Records
Tax History Compared to Growth
Tax History
| Year | Tax Paid | Tax Assessment Tax Assessment Total Assessment is a certain percentage of the fair market value that is determined by local assessors to be the total taxable value of land and additions on the property. | Land | Improvement |
|---|---|---|---|---|
| 2025 | $4,974 | $26,870 | $7,393 | $19,477 |
| 2024 | $4,986 | $26,165 | $7,991 | $18,174 |
| 2023 | $4,677 | $24,685 | $6,422 | $18,263 |
| 2022 | $4,362 | $35,760 | $11,160 | $24,600 |
| 2021 | $4,416 | $32,940 | $11,160 | $21,780 |
| 2020 | $4,444 | $30,780 | $11,160 | $19,620 |
| 2019 | $4,264 | $29,460 | $11,160 | $18,300 |
| 2018 | $3,896 | $20,571 | $9,938 | $10,633 |
| 2017 | $3,656 | $19,407 | $9,279 | $10,128 |
| 2016 | $3,420 | $19,407 | $9,279 | $10,128 |
| 2015 | $1,988 | $19,260 | $12,343 | $6,917 |
| 2014 | $1,988 | $18,170 | $11,363 | $6,807 |
Source: Public Records
Map
Nearby Homes
- 196-10 116th Ave
- 11608 196th St
- 19705 116th Ave
- 116-45 195th St
- 115-37 197th St
- 194-34 115th Rd
- 11620 194th St
- 194-19 115th Rd
- 115-47 199th St
- 197-13 118th Ave
- 191-68 115th Rd
- 11516 199th St
- 19815 118th Ave
- 197-20 118th Ave
- 114-64 198th St
- 116-39 192nd St
- 20017 Linden Blvd
- 114-22 197th St
- 114-28 198th St
- 191-47 114th Dr
- 11617 196th St
- 11623 196th St
- 116-23 196th St
- 11615 196th St
- 11611 196th St
- 116-11 196th St
- 11627 196th St
- 11620 197th St
- 116-14 197th St
- 11618 197th St
- 11622 197th St
- 11614 197th St
- 11626 197th St
- 116-18 197th St
- 11612 197th St
- 11631 196th St
- 11628 197th St
- 11626 197th St
- 19606 116th Ave
- 11612 197th St