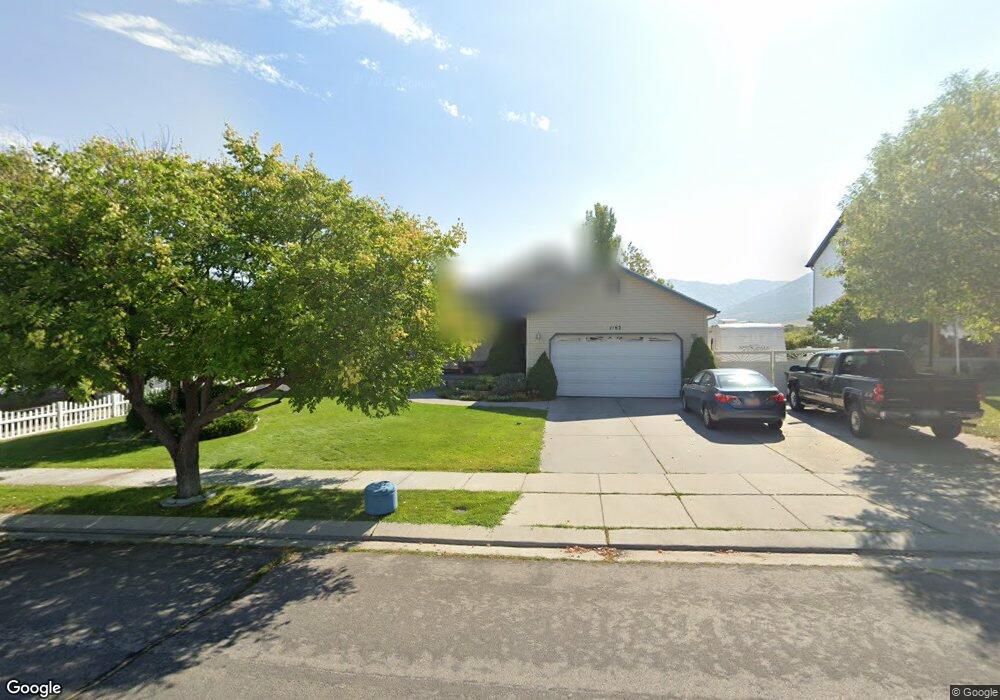
1162 N 690 E Tooele, UT 84074
Estimated Value: $470,000 - $553,000
Studio
--
Bath
3,126
Sq Ft
$163/Sq Ft
Est. Value
About This Home
This home is located at 1162 N 690 E, Tooele, UT 84074 and is currently estimated at $509,646, approximately $163 per square foot. 1162 N 690 E is a home located in Tooele County with nearby schools including Middle Canyon Elementary School, Tooele Junior High School, and Tooele High School.
Ownership History
Date
Name
Owned For
Owner Type
Purchase Details
Closed on
Jul 12, 2024
Sold by
Bankhead Leisa and Bankhead Mark E
Bought by
Bankhead Living Trust and Bankhead
Current Estimated Value
Purchase Details
Closed on
Oct 6, 2006
Sold by
Mathews Development Inc
Bought by
New Pride Builders Llc
Home Financials for this Owner
Home Financials are based on the most recent Mortgage that was taken out on this home.
Original Mortgage
$42,500
Interest Rate
6.44%
Mortgage Type
Purchase Money Mortgage
Create a Home Valuation Report for This Property
The Home Valuation Report is an in-depth analysis detailing your home's value as well as a comparison with similar homes in the area
Purchase History
| Date | Buyer | Sale Price | Title Company |
|---|---|---|---|
| Bankhead Living Trust | -- | Inwest Title | |
| New Pride Builders Llc | -- | B & D Title Co Of Tooele |
Source: Public Records
Mortgage History
| Date | Status | Borrower | Loan Amount |
|---|---|---|---|
| Previous Owner | New Pride Builders Llc | $42,500 |
Source: Public Records
Tax History
| Year | Tax Paid | Tax Assessment Tax Assessment Total Assessment is a certain percentage of the fair market value that is determined by local assessors to be the total taxable value of land and additions on the property. | Land | Improvement |
|---|---|---|---|---|
| 2025 | $3,457 | $524,256 | $112,500 | $411,756 |
| 2024 | $3,783 | $288,746 | $61,875 | $226,871 |
| 2023 | $3,783 | $305,490 | $58,915 | $246,575 |
| 2022 | $3,384 | $291,148 | $59,641 | $231,507 |
| 2021 | $2,806 | $201,938 | $23,856 | $178,082 |
| 2020 | $2,664 | $332,470 | $43,375 | $289,095 |
| 2019 | $2,494 | $306,189 | $43,375 | $262,814 |
| 2018 | $2,299 | $267,724 | $45,000 | $222,724 |
| 2017 | $1,864 | $257,593 | $30,000 | $227,593 |
| 2016 | $1,511 | $125,349 | $16,500 | $108,849 |
| 2015 | $1,511 | $109,870 | $0 | $0 |
| 2014 | -- | $109,870 | $0 | $0 |
Source: Public Records
Map
Nearby Homes
- 1194 N 690 E
- 1046 Cedarwood Rd
- 876 N Fox Run Dr
- 647 E 980 N
- 1224 E 970 N
- 475 E 1310 N
- 455 Lindy Way
- 472 E 1420 N
- 180 1000 N
- 405 E 1310 N
- 677 Kings Landing
- 208 E 850 N Unit A
- 224 E 850 N St Unit A
- 224 E 850 N Unit D
- 208 E 850 N Unit C
- 238 E 850 St N Unit D
- 438 E 1480 N
- 1266 E 850 N
- 1393 E 970 N
- 779 N 560 E
Your Personal Tour Guide
Ask me questions while you tour the home.