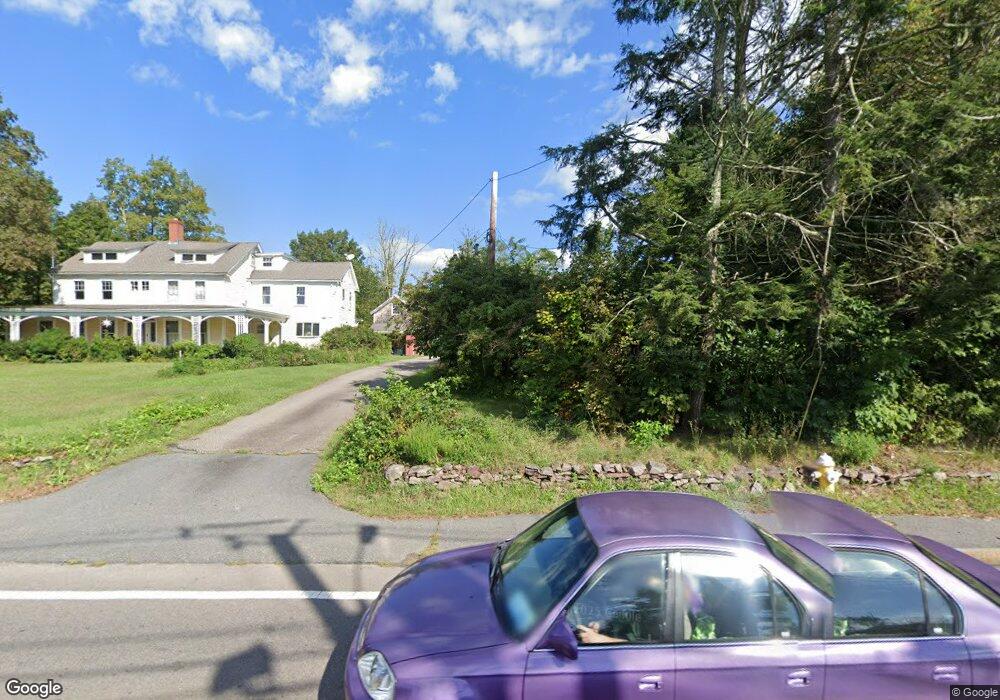
1162 West St Wrentham, MA 02093
Sheldonville NeighborhoodEstimated Value: $747,000 - $841,000
4
Beds
4
Baths
3,750
Sq Ft
$209/Sq Ft
Est. Value
About This Home
This home is located at 1162 West St, Wrentham, MA 02093 and is currently estimated at $783,801, approximately $209 per square foot. 1162 West St is a home located in Norfolk County with nearby schools including Delaney Elementary School, Charles E Roderick, and Mercymount Country Day School.
Ownership History
Date
Name
Owned For
Owner Type
Purchase Details
Closed on
Jul 26, 2022
Sold by
Hodgkins Anne K
Bought by
Britton Dylan and Hodgkins Alison
Current Estimated Value
Home Financials for this Owner
Home Financials are based on the most recent Mortgage that was taken out on this home.
Original Mortgage
$489,600
Outstanding Balance
$465,694
Interest Rate
5.23%
Mortgage Type
Purchase Money Mortgage
Estimated Equity
$318,107
Purchase Details
Closed on
Oct 18, 1977
Bought by
Hodgkins Alan C and Hodgkins Anne K
Create a Home Valuation Report for This Property
The Home Valuation Report is an in-depth analysis detailing your home's value as well as a comparison with similar homes in the area
Home Values in the Area
Average Home Value in this Area
Purchase History
| Date | Buyer | Sale Price | Title Company |
|---|---|---|---|
| Britton Dylan | $612,000 | None Available | |
| Hodgkins Alan C | -- | -- |
Source: Public Records
Mortgage History
| Date | Status | Borrower | Loan Amount |
|---|---|---|---|
| Open | Britton Dylan | $489,600 | |
| Previous Owner | Hodgkins Alan C | $645,000 | |
| Previous Owner | Hodgkins Alan C | $40,000 |
Source: Public Records
Tax History Compared to Growth
Tax History
| Year | Tax Paid | Tax Assessment Tax Assessment Total Assessment is a certain percentage of the fair market value that is determined by local assessors to be the total taxable value of land and additions on the property. | Land | Improvement |
|---|---|---|---|---|
| 2025 | $7,290 | $629,000 | $303,500 | $325,500 |
| 2024 | $7,118 | $593,200 | $303,500 | $289,700 |
| 2023 | $7,031 | $557,100 | $277,400 | $279,700 |
| 2022 | $5,751 | $420,700 | $270,600 | $150,100 |
| 2021 | $5,562 | $395,300 | $253,900 | $141,400 |
| 2020 | $4,918 | $345,100 | $197,500 | $147,600 |
| 2019 | $4,548 | $322,100 | $179,300 | $142,800 |
| 2018 | $4,545 | $319,200 | $177,600 | $141,600 |
| 2017 | $4,386 | $307,800 | $174,200 | $133,600 |
| 2016 | $4,334 | $303,500 | $169,100 | $134,400 |
| 2015 | $4,557 | $304,200 | $179,300 | $124,900 |
| 2014 | $4,587 | $299,600 | $172,500 | $127,100 |
Source: Public Records
Map
Nearby Homes