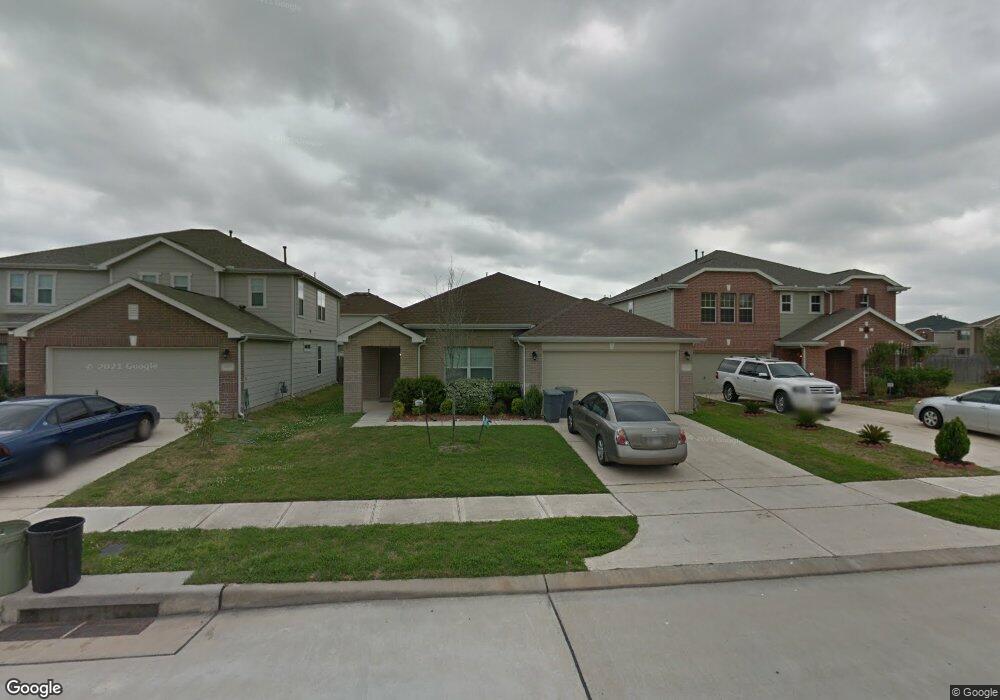
11622 Walnut Dale Ct Houston, TX 77038
North Houston NeighborhoodEstimated Value: $257,204 - $271,000
3
Beds
2
Baths
2,030
Sq Ft
$130/Sq Ft
Est. Value
About This Home
This home is located at 11622 Walnut Dale Ct, Houston, TX 77038 and is currently estimated at $264,051, approximately $130 per square foot. 11622 Walnut Dale Ct is a home located in Harris County with nearby schools including Kujawa EC/Pre-K/K School, Carter Academy, and Shotwell Middle School.
Ownership History
Date
Name
Owned For
Owner Type
Purchase Details
Closed on
May 15, 2017
Sold by
Rodriguez Bereneice and Rodriguez Jose M
Bought by
Pompa Juan G Verdecia and Gray Juliet M De Oca
Current Estimated Value
Home Financials for this Owner
Home Financials are based on the most recent Mortgage that was taken out on this home.
Original Mortgage
$152,192
Outstanding Balance
$126,497
Interest Rate
4.08%
Mortgage Type
Stand Alone Second
Estimated Equity
$137,554
Purchase Details
Closed on
Dec 31, 2016
Sold by
Garzoria Daniel
Bought by
Rodriguez Berenice
Purchase Details
Closed on
Aug 12, 2016
Sold by
Salinas Reynol A and Salinas Maria
Bought by
Garzoria Daniel
Purchase Details
Closed on
Sep 27, 2007
Sold by
Kb Home Lone Star Inc
Bought by
Salinas Maria and Salinas Reynol A
Home Financials for this Owner
Home Financials are based on the most recent Mortgage that was taken out on this home.
Original Mortgage
$121,532
Interest Rate
6.55%
Mortgage Type
Purchase Money Mortgage
Create a Home Valuation Report for This Property
The Home Valuation Report is an in-depth analysis detailing your home's value as well as a comparison with similar homes in the area
Home Values in the Area
Average Home Value in this Area
Purchase History
| Date | Buyer | Sale Price | Title Company |
|---|---|---|---|
| Pompa Juan G Verdecia | -- | None Available | |
| Rodriguez Berenice | $7,700 | None Available | |
| Garzoria Daniel | -- | None Available | |
| Salinas Maria | -- | First American Title |
Source: Public Records
Mortgage History
| Date | Status | Borrower | Loan Amount |
|---|---|---|---|
| Open | Pompa Juan G Verdecia | $152,192 | |
| Closed | Pompa Juan G Verdecia | $152,192 | |
| Previous Owner | Salinas Maria | $121,532 |
Source: Public Records
Tax History Compared to Growth
Tax History
| Year | Tax Paid | Tax Assessment Tax Assessment Total Assessment is a certain percentage of the fair market value that is determined by local assessors to be the total taxable value of land and additions on the property. | Land | Improvement |
|---|---|---|---|---|
| 2025 | $5,756 | $247,679 | $53,781 | $193,898 |
| 2024 | $5,756 | $234,310 | $53,781 | $180,529 |
| 2023 | $5,756 | $259,618 | $53,781 | $205,837 |
| 2022 | $6,416 | $226,247 | $30,030 | $196,217 |
| 2021 | $6,059 | $175,349 | $30,030 | $145,319 |
| 2020 | $6,005 | $168,142 | $30,030 | $138,112 |
| 2019 | $5,692 | $155,204 | $21,840 | $133,364 |
| 2018 | $2,020 | $140,663 | $21,840 | $118,823 |
| 2017 | $5,017 | $140,663 | $21,840 | $118,823 |
| 2016 | $3,924 | $140,663 | $21,840 | $118,823 |
| 2015 | $2,896 | $140,663 | $21,840 | $118,823 |
| 2014 | $2,896 | $104,907 | $21,840 | $83,067 |
Source: Public Records
Map
Nearby Homes
- 11623 Quinn Ridge Way
- 11707 Madison Oak St
- 2934 Washington Dr
- 2930 Washington Dr
- 11638 Township Dale Ct
- 9218 Washington Dr
- 9217 Washington Dr
- 9206 Washington Dr
- 11727 State Highway 249
- 11618 Wren Crossing Dr
- 2845 Washington Dr
- 2746 Piney Lake Ct
- 2907 Valiant Scene Ct
- 11726 Wren Crossing Dr
- 2743 Oriole Wood Ct
- 2934 Valiant Scene Ct
- 9221 Washington Dr
- 10809 W Montgomery Rd
- 2846 W Mount Houston Rd
- 12006 Mallard Stream Ct
- 11618 Walnut Dale Ct
- 11626 Walnut Dale Ct
- 11623 Walnut Dale Ct
- 11630 Walnut Dale Ct
- 11615 Walnut Dale Ct
- 11611 Walnut Dale Ct
- 11615 Quinn Ridge Way
- 11619 Quinn Ridge Way
- 11619 Walnut Dale Ct
- 2902 Walnut View Ct
- 11634 Walnut Dale Ct
- 11611 Quinn Ridge Way
- 11607 Quinn Ridge Way
- 11607 Walnut Dale Ct
- 11627 Quinn Ridge Way
- 11603 Quinn Ridge Way
- 2911 Walnut View Ct
- 11638 Walnut Dale Ct
- 11638 Walnut Dale Ct
- 11603 Walnut Dale Ct