Estimated Value: $253,625 - $278,000
3
Beds
1
Bath
1,240
Sq Ft
$213/Sq Ft
Est. Value
About This Home
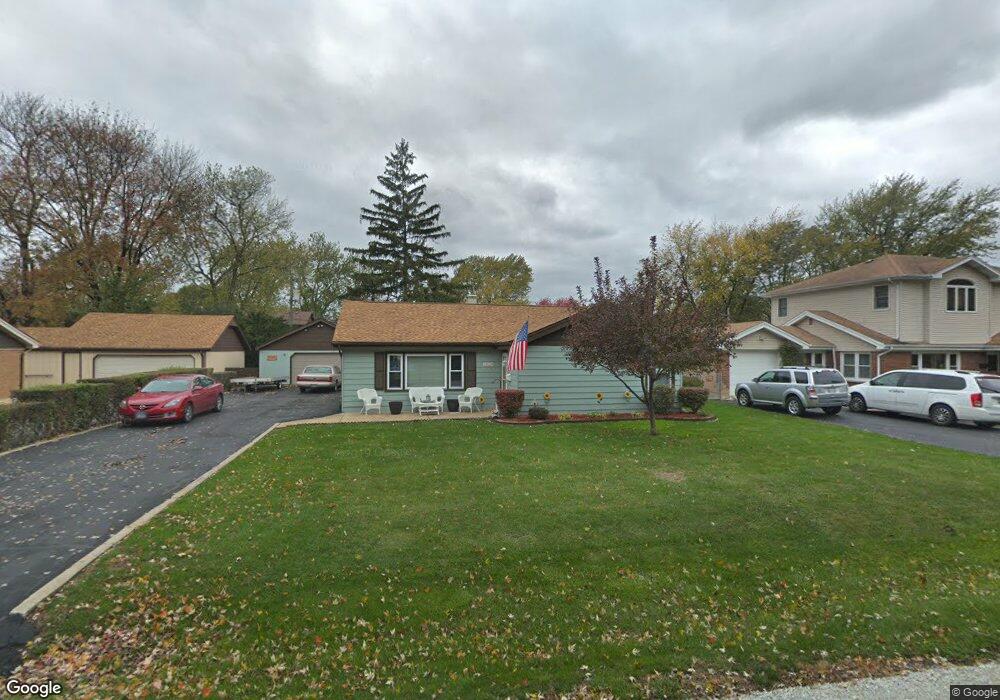
This home is located at 11624 S Nagle Ave, Worth, IL 60482 and is currently estimated at $264,156, approximately $213 per square foot. 11624 S Nagle Ave is a home located in Cook County with nearby schools including Worth Elementary School, Worth Jr High School, and A B Shepard High School.
Ownership History
Date
Name
Owned For
Owner Type
Purchase Details
Closed on
Aug 8, 2022
Sold by
Nelson Thomas A and Nelson Nancy E
Bought by
Trust Agreement Of Thomas Alfred Nelson And N and Nelson
Current Estimated Value
Purchase Details
Closed on
Oct 18, 2005
Sold by
Nelson Nancy E and Nelson Van Witzenberg
Bought by
Nelson Thomas A and Nelson Nancy E
Home Financials for this Owner
Home Financials are based on the most recent Mortgage that was taken out on this home.
Original Mortgage
$112,500
Interest Rate
5.89%
Mortgage Type
New Conventional
Purchase Details
Closed on
Apr 20, 2001
Sold by
Przybylski Edward
Bought by
Vanwitzenberg Nancy
Home Financials for this Owner
Home Financials are based on the most recent Mortgage that was taken out on this home.
Original Mortgage
$94,000
Interest Rate
6.99%
Purchase Details
Closed on
Dec 28, 1998
Sold by
Suitca Julianne
Bought by
Przybilski Edward
Create a Home Valuation Report for This Property
The Home Valuation Report is an in-depth analysis detailing your home's value as well as a comparison with similar homes in the area
Home Values in the Area
Average Home Value in this Area
Purchase History
| Date | Buyer | Sale Price | Title Company |
|---|---|---|---|
| Trust Agreement Of Thomas Alfred Nelson And N | -- | None Listed On Document | |
| Nelson Thomas A | -- | Nations | |
| Vanwitzenberg Nancy | $130,000 | -- | |
| Przybilski Edward | $60,000 | -- |
Source: Public Records
Mortgage History
| Date | Status | Borrower | Loan Amount |
|---|---|---|---|
| Previous Owner | Nelson Thomas A | $112,500 | |
| Previous Owner | Vanwitzenberg Nancy | $94,000 |
Source: Public Records
Tax History Compared to Growth
Tax History
| Year | Tax Paid | Tax Assessment Tax Assessment Total Assessment is a certain percentage of the fair market value that is determined by local assessors to be the total taxable value of land and additions on the property. | Land | Improvement |
|---|---|---|---|---|
| 2024 | $4,900 | $17,000 | $5,895 | $11,105 |
| 2023 | $5,342 | $17,000 | $5,895 | $11,105 |
| 2022 | $5,342 | $16,084 | $5,158 | $10,926 |
| 2021 | $5,177 | $16,084 | $5,158 | $10,926 |
| 2020 | $5,151 | $16,084 | $5,158 | $10,926 |
| 2019 | $4,650 | $14,509 | $4,666 | $9,843 |
| 2018 | $4,628 | $14,509 | $4,666 | $9,843 |
| 2017 | $4,651 | $14,509 | $4,666 | $9,843 |
| 2016 | $4,010 | $11,457 | $3,930 | $7,527 |
| 2015 | $5,646 | $12,851 | $3,930 | $8,921 |
| 2014 | $4,428 | $12,851 | $3,930 | $8,921 |
| 2013 | $4,868 | $15,177 | $3,930 | $11,247 |
Source: Public Records
Map
Nearby Homes
- 11554 S Neenah Ave
- 11512 S Nagle Ave
- 11400 S Ridgeland Ave
- 6710 W 115th St
- 11524 S Ridgeland Ave
- 11258 S Normandy Ave
- 6532 W 112th St
- 6545 W 111th St
- 12246 S Nagle Ave
- 12256 S Arbor Trail Unit 11W
- 11109 S Normandy Ave
- 7112 W 114th Place
- 7117 W 113th Place
- 6040 111th St
- 6737 W Lloyd Dr
- 10931 S Lloyd Dr Unit 1B
- 10910 S Natchez Ave
- 6856 W Crandall Ave
- 10937 Moody Ave
- 11024 Mason Ave
- 11630 S Nagle Ave
- 11618 S Nagle Ave
- 11625 S Natchez Ave
- 11636 S Nagle Ave
- 11631 S Natchez Ave
- 11612 S Nagle Ave
- 11619 S Natchez Ave
- 11637 S Natchez Ave
- 11613 S Natchez Ave
- 11619 S Nagle Ave
- 11631 S Nagle Ave
- 11642 S Nagle Ave
- 11613 S Nagle Ave
- 11637 S Nagle Ave
- 11643 S Natchez Ave
- 11607 S Natchez Ave
- 11607 S Nagle Ave
- 11643 S Nagle Ave
- 11600 S Nagle Ave
- 11648 S Nagle Ave