11629 Dove Creek Ln E San Angelo, TX 76904
Estimated Value: $369,000 - $639,000
--
Bed
--
Bath
1,992
Sq Ft
$250/Sq Ft
Est. Value
About This Home
This home is located at 11629 Dove Creek Ln E, San Angelo, TX 76904 and is currently estimated at $498,760, approximately $250 per square foot. 11629 Dove Creek Ln E is a home located in Tom Green County with nearby schools including Christoval Elementary School and Christoval High School.
Ownership History
Date
Name
Owned For
Owner Type
Purchase Details
Closed on
Sep 27, 2024
Sold by
Barnhill Danny and Barnhill Paul Daniel
Bought by
Barnhill Family Revocable Trust and Barnhill
Current Estimated Value
Purchase Details
Closed on
Mar 6, 2007
Sold by
Heflin Herb D and Heflin Diane A
Bought by
Barnhill Danny and Barnhill Christy S
Purchase Details
Closed on
Oct 11, 2006
Sold by
Robertson Rodney and Robertson Barbara
Bought by
Barnhill Danny and Barnhill Christy S
Purchase Details
Closed on
Apr 30, 2004
Sold by
Shary Robert Francis and Shary Elizabeth
Bought by
Barnhill Danny and Barnhill Christy S
Purchase Details
Closed on
Jan 13, 1998
Sold by
Wheeler James C and Wheeler Sharon R
Bought by
Barnhill Danny and Barnhill Christy S
Purchase Details
Closed on
Jul 26, 1994
Sold by
Bratton Paul J and Bratton Glenna M
Bought by
Barnhill Danny and Barnhill Christy S
Purchase Details
Closed on
Jun 29, 1994
Sold by
Dove Creek Development Co (Owner)
Bought by
Barnhill Danny and Barnhill Christy S
Create a Home Valuation Report for This Property
The Home Valuation Report is an in-depth analysis detailing your home's value as well as a comparison with similar homes in the area
Home Values in the Area
Average Home Value in this Area
Purchase History
| Date | Buyer | Sale Price | Title Company |
|---|---|---|---|
| Barnhill Family Revocable Trust | -- | None Listed On Document | |
| Barnhill Danny | -- | -- | |
| Barnhill Danny | -- | -- | |
| Barnhill Danny | -- | -- | |
| Barnhill Danny | -- | -- | |
| Barnhill Danny | -- | -- | |
| Barnhill Danny | -- | -- |
Source: Public Records
Tax History Compared to Growth
Tax History
| Year | Tax Paid | Tax Assessment Tax Assessment Total Assessment is a certain percentage of the fair market value that is determined by local assessors to be the total taxable value of land and additions on the property. | Land | Improvement |
|---|---|---|---|---|
| 2025 | $2,743 | $341,720 | $17,000 | $324,720 |
| 2024 | $2,639 | $386,020 | $17,000 | $300,170 |
| 2023 | $2,866 | $425,670 | $19,200 | $334,780 |
| 2022 | $5,108 | $352,560 | $70,700 | $281,860 |
| 2021 | $4,872 | $322,840 | $0 | $0 |
| 2020 | $5,706 | $322,930 | $70,700 | $252,230 |
| 2019 | $5,693 | $323,010 | $70,700 | $252,310 |
| 2018 | $5,485 | $313,000 | $60,600 | $252,400 |
| 2017 | $5,366 | $250,740 | $60,600 | $250,740 |
| 2016 | $5,378 | $251,430 | $60,600 | $251,430 |
| 2015 | $1,350 | $78,310 | $60,600 | $17,710 |
| 2014 | $1,073 | $60,600 | $60,600 | $0 |
| 2013 | $581 | $32,800 | $0 | $0 |
Source: Public Records
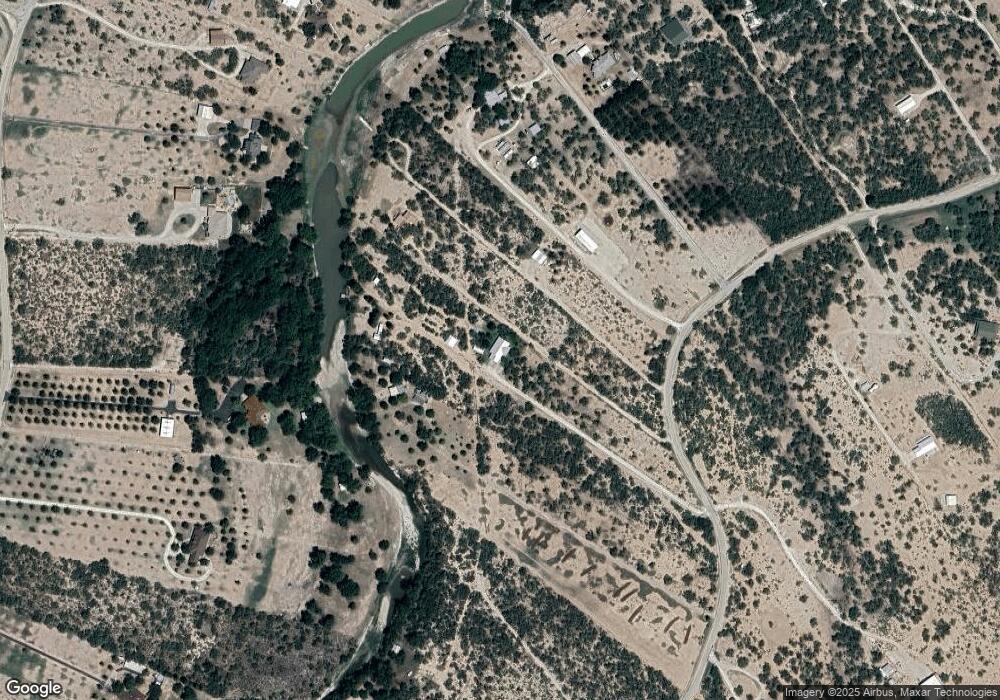
Map
Nearby Homes
- 12315 Dove Creek Ln W
- 12237 Dove Creek Ln W
- 12182 Spring Creek Ln
- 12846 Dove Creek Ln W
- 12274 Twin Lakes Ln
- 11954 Lagoon Ln
- 13442 S Farm To Market Road 2335
- 13526 S Dove Creek Rd
- 10561 Twin Lakes Ln
- 13538 Fm 2335
- 13914 S Dove Creek Rd
- 12183 W Torres Rd
- 0000 Fm 2166
- 9434 Bryant Ln
- 0 Hwy 67 Unit 120767
- 6704 Eugene Trail Unit 43
- 9225 Remuda Ln Unit 64
- 9201 Remuda Ln Unit 62
- 9071 W Fm 2335
- 9213 Remuda Ln
- 11697 Dove Creek Ln E
- 11537 Dove Creek Ln E
- n/a Dove Creek Ln E Unit TR 11, 12, 13
- n/a Dove Creek Ln E Unit 5.030 acres in Tract
- 12541 Dove Creek Ln W
- 11489 Dove Creek Ln E
- 12509 Dove Creek Ln W
- 12497 Dove Creek Ln W
- 11453 Dove Creek Ln E
- 12485 Dove Creek Ln W
- 12569 Dove Creek Ln W
- 11429 Dove Creek Ln E
- 12433 Dove Creek Ln W
- 12377 Dove Creek Ln W
- 1553 Dove Creek Ln E
- 11553 Dove Creek Ln E
- 0 Dove Creek Ln E Unit 42450
- 11460 Dove Creek Ln E Unit trc 6
- 0 Dove Creek Ln E Unit 1
- 11829 Dove Creek Ln E