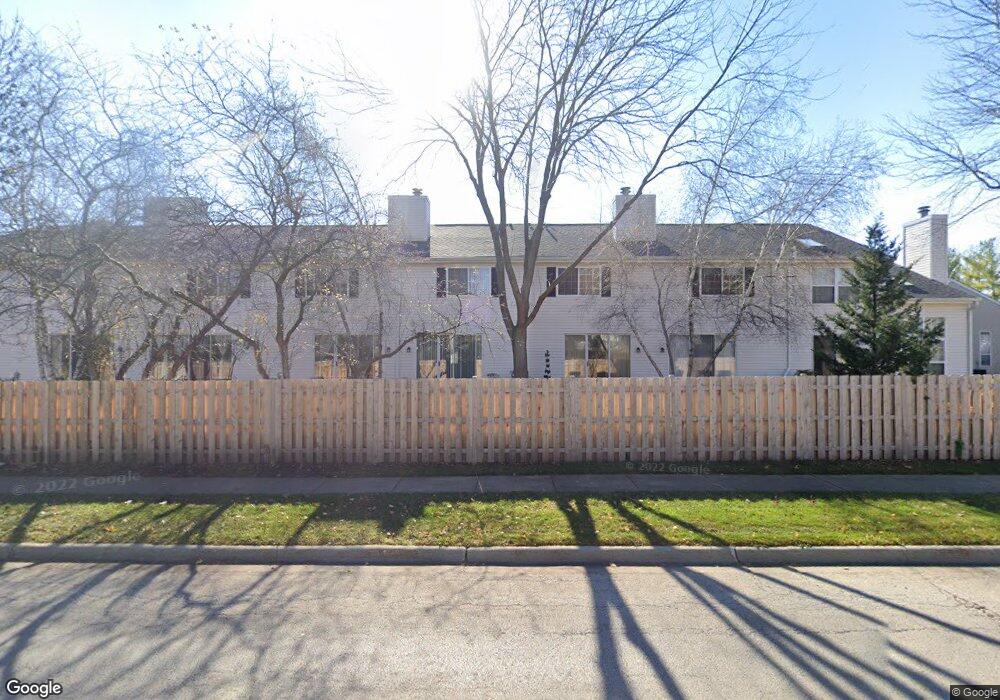
1163 Heartland Gate Lake In the Hills, IL 60156
Estimated Value: $248,842 - $292,000
2
Beds
2
Baths
1,389
Sq Ft
$192/Sq Ft
Est. Value
About This Home
This home is located at 1163 Heartland Gate, Lake In the Hills, IL 60156 and is currently estimated at $266,961, approximately $192 per square foot. 1163 Heartland Gate is a home located in McHenry County with nearby schools including Indian Prairie Elementary School, Lundahl Middle School, and Crystal Lake South High School.
Ownership History
Date
Name
Owned For
Owner Type
Purchase Details
Closed on
Dec 18, 2008
Sold by
Alexander Zemiria and Nembhard Henry
Bought by
Nembhard Family Trust
Current Estimated Value
Home Financials for this Owner
Home Financials are based on the most recent Mortgage that was taken out on this home.
Original Mortgage
$173,518
Interest Rate
5.19%
Mortgage Type
FHA
Purchase Details
Closed on
Nov 21, 2008
Sold by
Alexander Zemiria
Bought by
Alexander Zemiria and Nembhard Henry
Home Financials for this Owner
Home Financials are based on the most recent Mortgage that was taken out on this home.
Original Mortgage
$173,518
Interest Rate
5.19%
Mortgage Type
FHA
Purchase Details
Closed on
Dec 16, 1996
Sold by
Pinnacle Corp
Bought by
Alexander Zemiria
Home Financials for this Owner
Home Financials are based on the most recent Mortgage that was taken out on this home.
Original Mortgage
$130,900
Interest Rate
7.74%
Mortgage Type
FHA
Create a Home Valuation Report for This Property
The Home Valuation Report is an in-depth analysis detailing your home's value as well as a comparison with similar homes in the area
Home Values in the Area
Average Home Value in this Area
Purchase History
| Date | Buyer | Sale Price | Title Company |
|---|---|---|---|
| Nembhard Family Trust | -- | Chicago Title | |
| Alexander Zemiria | -- | Chicago Title | |
| Alexander Zemiria | $133,500 | Chicago Title |
Source: Public Records
Mortgage History
| Date | Status | Borrower | Loan Amount |
|---|---|---|---|
| Previous Owner | Alexander Zemiria | $173,518 | |
| Previous Owner | Alexander Zemiria | $130,900 |
Source: Public Records
Tax History Compared to Growth
Tax History
| Year | Tax Paid | Tax Assessment Tax Assessment Total Assessment is a certain percentage of the fair market value that is determined by local assessors to be the total taxable value of land and additions on the property. | Land | Improvement |
|---|---|---|---|---|
| 2024 | $2,961 | $78,494 | $15,603 | $62,891 |
| 2023 | $3,226 | $70,203 | $13,955 | $56,248 |
| 2022 | $4,181 | $53,529 | $12,595 | $40,934 |
| 2021 | $3,903 | $49,869 | $11,734 | $38,135 |
| 2020 | $3,790 | $48,104 | $11,319 | $36,785 |
| 2019 | $3,650 | $46,042 | $10,834 | $35,208 |
| 2018 | $2,495 | $34,303 | $10,008 | $24,295 |
| 2017 | $2,431 | $32,315 | $9,428 | $22,887 |
| 2016 | $2,312 | $30,309 | $8,843 | $21,466 |
| 2013 | -- | $40,067 | $8,249 | $31,818 |
Source: Public Records
Map
Nearby Homes
- 1171 Heartland Gate
- 1162 Heartland Gate
- 201 Northlight Passe
- 15 W Oak St Unit 5
- 1724 Hartford Ln
- 1323 Monroe St
- 1740 Bradford Ln
- 1694 Penny Ln Unit A
- 1207 Crystal Lake Rd
- 1668 Penn Ct Unit A
- 187 Hilltop Dr
- 1823 Somerfield Ln
- 1506 Monroe St
- 1197 Prides Run
- 1655 Kennsington Ln
- 761 Village Rd
- 206 Cool Stone Bend
- 3 Barton Creek Ct
- 202 Cool Stone Bend
- 1549 Brompton Ln
- 1161 Heartland Gate
- 121 Northlight Passe
- 129 Northlight Passe
- 117 Northlight Passe
- 127 Northlight Passe
- 125 Northlight Passe
- 131 Northlight Passe
- 119 Northlight Passe
- 1159 Heartland Gate
- 1157 Heartland Gate
- 1167 Heartland Gate
- 1155 Heartland Gate
- 1153 Heartland Gate
- 172 Northlight Passe
- 170 Northlight Passe
- 168 Northlight Passe
- 1169 Heartland Gate
- 154A Northlight Passe
- 174 Northlight Passe
- 176 Northlight Passe