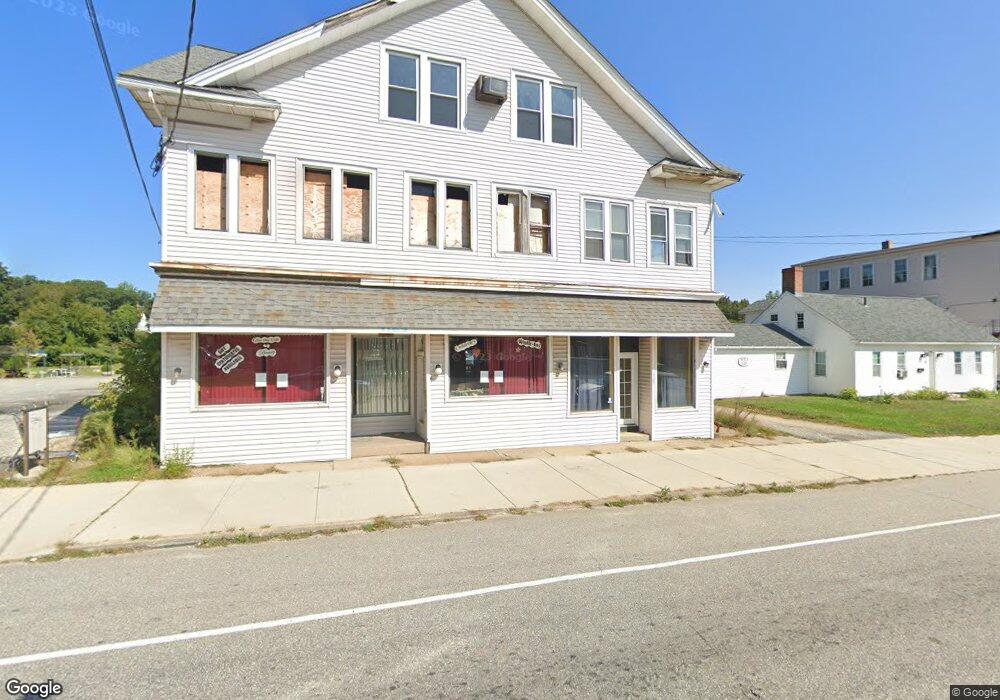
1163 Main St Willimantic, CT 06226
Estimated Value: $170,909
2
Beds
--
Bath
4,592
Sq Ft
$37/Sq Ft
Est. Value
About This Home
This home is located at 1163 Main St, Willimantic, CT 06226 and is currently estimated at $170,909, approximately $37 per square foot. 1163 Main St is a home located in Windham County with nearby schools including Windham Middle School, Windham High School, and St Mary St Joseph School.
Ownership History
Date
Name
Owned For
Owner Type
Purchase Details
Closed on
Feb 28, 2023
Sold by
S & P Properties Llc
Bought by
Sri Vasvik Inc
Current Estimated Value
Purchase Details
Closed on
Jun 30, 2005
Sold by
Sokolowski Rudolph and Sokolowski Shirley
Bought by
S & P Properties Llc
Home Financials for this Owner
Home Financials are based on the most recent Mortgage that was taken out on this home.
Original Mortgage
$152,028
Interest Rate
5.73%
Mortgage Type
Commercial
Create a Home Valuation Report for This Property
The Home Valuation Report is an in-depth analysis detailing your home's value as well as a comparison with similar homes in the area
Home Values in the Area
Average Home Value in this Area
Purchase History
| Date | Buyer | Sale Price | Title Company |
|---|---|---|---|
| Sri Vasvik Inc | $135,000 | None Available | |
| S & P Properties Llc | $131,000 | -- |
Source: Public Records
Mortgage History
| Date | Status | Borrower | Loan Amount |
|---|---|---|---|
| Previous Owner | S & P Properties Llc | $152,028 |
Source: Public Records
Tax History
| Year | Tax Paid | Tax Assessment Tax Assessment Total Assessment is a certain percentage of the fair market value that is determined by local assessors to be the total taxable value of land and additions on the property. | Land | Improvement |
|---|---|---|---|---|
| 2025 | $5,069 | $136,930 | $37,840 | $99,090 |
| 2024 | $5,075 | $136,930 | $37,840 | $99,090 |
| 2023 | $5,562 | $117,350 | $32,900 | $84,450 |
| 2022 | $5,480 | $117,350 | $32,900 | $84,450 |
| 2021 | $5,878 | $117,350 | $32,900 | $84,450 |
| 2020 | $5,865 | $117,350 | $32,900 | $84,450 |
| 2019 | $5,770 | $117,350 | $32,900 | $84,450 |
| 2017 | $4,562 | $95,830 | $31,040 | $64,790 |
| 2015 | $3,292 | $95,830 | $31,040 | $64,790 |
| 2014 | $4,162 | $95,830 | $31,040 | $64,790 |
Source: Public Records
Map
Nearby Homes
- 1170 Main St
- 1161 Main St
- 1158 Main St
- 1173 Main St
- 1153 Main St Unit 3B
- 1153 Main St Unit 3A
- 1153 Main St
- 19 Arnolds Ln
- 16 Winter St
- 1185 Main St Unit 1st flr, left
- 20 Winter St
- 27 Arnolds Ln
- 22 Winter St
- 28 Arnolds Ln
- 31 Arnolds Ln
- 23 Winter St
- 29 Ivan Hill St
- 35 Arnolds Ln
- 30 Winter St
- 34 Winter St
Your Personal Tour Guide
Ask me questions while you tour the home.