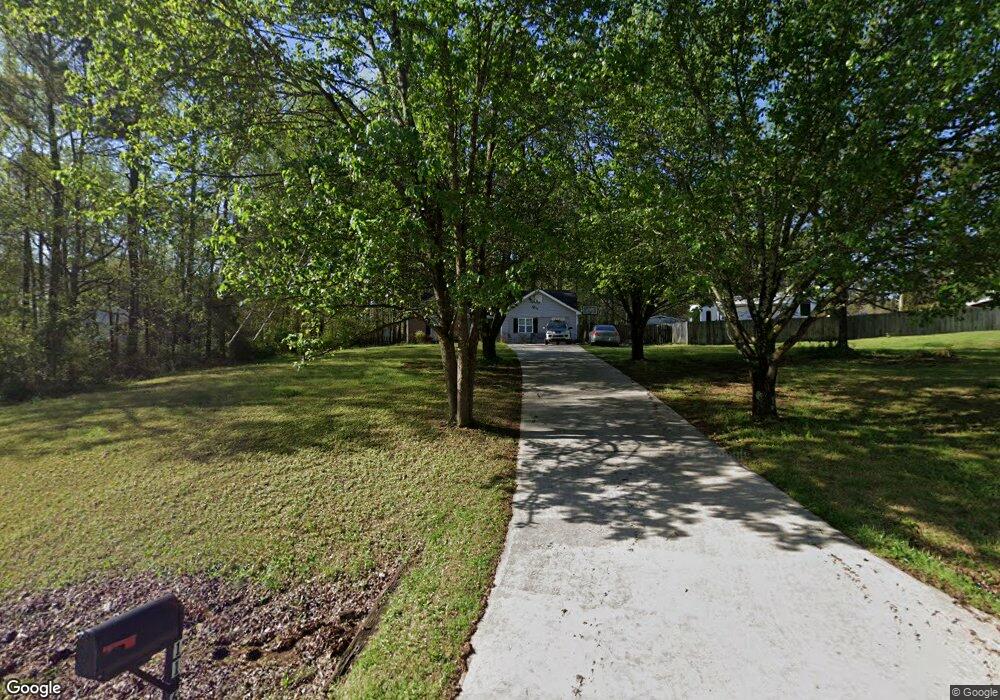
1163 Pinebrook Rd Unit I Auburn, GA 30011
Estimated Value: $280,000 - $311,000
3
Beds
2
Baths
1,304
Sq Ft
$227/Sq Ft
Est. Value
About This Home
This home is located at 1163 Pinebrook Rd Unit I, Auburn, GA 30011 and is currently estimated at $295,565, approximately $226 per square foot. 1163 Pinebrook Rd Unit I is a home located in Barrow County with nearby schools including Kennedy Elementary School, Westside Middle School, and Apalachee High School.
Ownership History
Date
Name
Owned For
Owner Type
Purchase Details
Closed on
Mar 23, 2001
Sold by
Chase Manhattan Mtg Corp
Bought by
Asta Marie R
Current Estimated Value
Home Financials for this Owner
Home Financials are based on the most recent Mortgage that was taken out on this home.
Original Mortgage
$101,195
Interest Rate
7.05%
Mortgage Type
FHA
Purchase Details
Closed on
Dec 7, 2000
Sold by
Short Scott C
Bought by
Chase Manhattan Mtg Corp
Purchase Details
Closed on
Jan 23, 1998
Sold by
Sheram Wade M and Sheram Faye L
Bought by
Short Scott C
Home Financials for this Owner
Home Financials are based on the most recent Mortgage that was taken out on this home.
Original Mortgage
$88,000
Interest Rate
7.19%
Mortgage Type
New Conventional
Purchase Details
Closed on
Dec 18, 1992
Bought by
Sheram Wade M And
Create a Home Valuation Report for This Property
The Home Valuation Report is an in-depth analysis detailing your home's value as well as a comparison with similar homes in the area
Home Values in the Area
Average Home Value in this Area
Purchase History
| Date | Buyer | Sale Price | Title Company |
|---|---|---|---|
| Asta Marie R | $102,000 | -- | |
| Chase Manhattan Mtg Corp | $95,000 | -- | |
| Short Scott C | $86,900 | -- | |
| Sheram Wade M And | $67,100 | -- |
Source: Public Records
Mortgage History
| Date | Status | Borrower | Loan Amount |
|---|---|---|---|
| Previous Owner | Asta Marie R | $101,195 | |
| Previous Owner | Short Scott C | $88,000 |
Source: Public Records
Tax History Compared to Growth
Tax History
| Year | Tax Paid | Tax Assessment Tax Assessment Total Assessment is a certain percentage of the fair market value that is determined by local assessors to be the total taxable value of land and additions on the property. | Land | Improvement |
|---|---|---|---|---|
| 2024 | $1,409 | $64,096 | $18,000 | $46,096 |
| 2023 | $999 | $64,496 | $18,000 | $46,496 |
| 2022 | $1,370 | $53,426 | $12,000 | $41,426 |
| 2021 | $1,429 | $53,426 | $12,000 | $41,426 |
| 2020 | $1,299 | $47,956 | $12,000 | $35,956 |
| 2019 | $1,256 | $45,256 | $12,000 | $33,256 |
| 2018 | $1,233 | $45,256 | $12,000 | $33,256 |
| 2017 | $1,025 | $35,190 | $9,600 | $25,590 |
| 2016 | $810 | $30,600 | $8,000 | $22,600 |
| 2015 | $822 | $30,896 | $8,000 | $22,896 |
| 2014 | $774 | $29,368 | $5,880 | $23,488 |
| 2013 | -- | $28,302 | $5,880 | $22,422 |
Source: Public Records
Map
Nearby Homes
- 1162 Pinebrook Rd Unit 1
- 1236 Cabots Dr
- 624 Red Fox Ln
- 1201 Saint Andrews Dr
- 4079 Brookmont Way
- 5779 Wheeler Ridge Rd
- 305 Crosswalk Dr
- 410 Kilcrease Rd
- 1306 Stonemont Rd Unit 1
- 1308 Smokerise Ln
- 1237 Carl Bethlehem Rd
- 23 Woodland Rd
- 302 Jonaquil Ave
- 298 Dandelion Ln
- 0 Patrick Mill Rd SW Unit 10654215
- 0 Patrick Mill Rd SW Unit 7689708
- 569 Appalachee Ridge Rd
- 1071 Atlanta Hwy NW
- 7 Deer Run Trail
- 1120 Carl Bethlehem Rd
- 1165 Pinebrook Rd
- 1159 Pinebrook Rd Unit 1
- 1173 Pinebrook Ct
- 1169 Pinebrook Ct
- 1167 Pinebrook Ct
- 1175 Pinebrook Ct
- 1164 Pinebrook Rd
- 1164 Pinebrook Rd Unit I
- 1160 Pinebrook Rd
- 1166 Pinebrook Rd
- 1168 Pinebrook Rd
- 1158 Pinebrook Rd
- 1177 Pinebrook Ct
- 1170 Pinebrook Ct
- 282 Kennedy Sells Rd
- 1187 Kennedy Dr
- 1156 Pinebrook Rd
- 1170 Pinebrook Rd Unit 1
- 1174 Pinebrook Ct Unit 1
- 1172 Pinebrook Ct