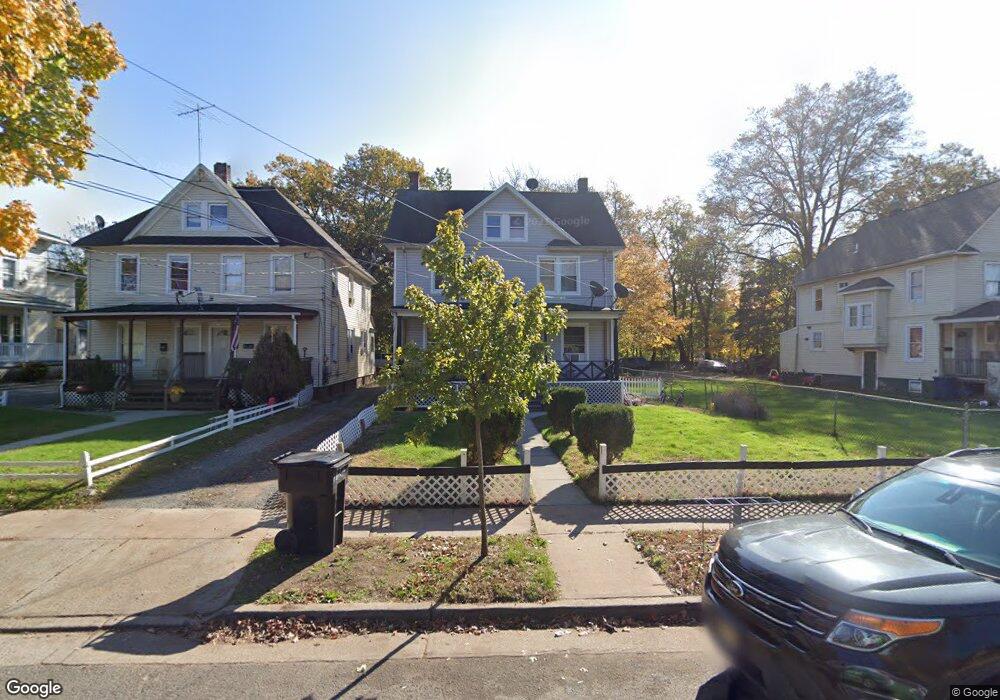
1163 S 2nd St Unit 65 Plainfield, NJ 07063
Estimated Value: $389,507 - $609,000
--
Bed
--
Bath
2,408
Sq Ft
$222/Sq Ft
Est. Value
About This Home
This home is located at 1163 S 2nd St Unit 65, Plainfield, NJ 07063 and is currently estimated at $535,627, approximately $222 per square foot. 1163 S 2nd St Unit 65 is a home located in Union County with nearby schools including Jefferson Elementary School, Hubbard Middle School, and Plainfield High School.
Ownership History
Date
Name
Owned For
Owner Type
Purchase Details
Closed on
Dec 16, 2017
Sold by
Nelson Michael O and Nelson Michael
Bought by
Nelson Michael O
Current Estimated Value
Home Financials for this Owner
Home Financials are based on the most recent Mortgage that was taken out on this home.
Original Mortgage
$177,750
Outstanding Balance
$149,689
Interest Rate
3.95%
Mortgage Type
New Conventional
Estimated Equity
$385,938
Purchase Details
Closed on
Mar 31, 2000
Sold by
Barron Sylvia A and Mcintyre Merdithy
Bought by
Nelson Micheal
Home Financials for this Owner
Home Financials are based on the most recent Mortgage that was taken out on this home.
Original Mortgage
$99,150
Interest Rate
8.21%
Mortgage Type
FHA
Purchase Details
Closed on
Jun 14, 1994
Sold by
Allen Isaac M and Allen Eartha M
Bought by
Barron Sylvia A and Mcintyre Merdithy
Create a Home Valuation Report for This Property
The Home Valuation Report is an in-depth analysis detailing your home's value as well as a comparison with similar homes in the area
Home Values in the Area
Average Home Value in this Area
Purchase History
| Date | Buyer | Sale Price | Title Company |
|---|---|---|---|
| Nelson Michael O | -- | Title365 | |
| Nelson Micheal | $100,000 | Commonwealth Land Title Ins | |
| Barron Sylvia A | -- | -- |
Source: Public Records
Mortgage History
| Date | Status | Borrower | Loan Amount |
|---|---|---|---|
| Open | Nelson Michael O | $177,750 | |
| Closed | Nelson Micheal | $99,150 |
Source: Public Records
Tax History Compared to Growth
Tax History
| Year | Tax Paid | Tax Assessment Tax Assessment Total Assessment is a certain percentage of the fair market value that is determined by local assessors to be the total taxable value of land and additions on the property. | Land | Improvement |
|---|---|---|---|---|
| 2025 | $6,855 | $78,500 | $30,800 | $47,700 |
| 2024 | $6,787 | $78,500 | $30,800 | $47,700 |
| 2023 | $6,787 | $78,500 | $30,800 | $47,700 |
| 2022 | $6,640 | $78,500 | $30,800 | $47,700 |
| 2021 | $6,582 | $78,500 | $30,800 | $47,700 |
| 2020 | $6,563 | $78,500 | $30,800 | $47,700 |
| 2019 | $6,563 | $78,500 | $30,800 | $47,700 |
| 2018 | $6,426 | $78,500 | $30,800 | $47,700 |
| 2017 | $6,269 | $78,500 | $30,800 | $47,700 |
| 2016 | $6,141 | $78,500 | $30,800 | $47,700 |
| 2015 | $5,960 | $78,500 | $30,800 | $47,700 |
| 2014 | -- | $78,500 | $30,800 | $47,700 |
Source: Public Records
Map
Nearby Homes
- 1222 W 3rd St Unit 24
- 1637 S 2nd St
- 318 Halsey St Unit 20
- 355 Bergen St
- 333 Mcdowell St Unit 35
- 318-20 Manson Place
- 1357-1403 S 2nd St Unit 2
- 1357-1403 S 2nd St
- 338 Manson Place Unit 40
- 40 Emma St Unit 42
- 20-22 Albert St
- 312 Monroe Ave Unit 14
- 667 S 2nd St
- 223 Monroe Ave
- 1408 W 5th St
- 1227 W 6th St
- 73-81 Mariners Ct
- 951 W Front St
- 1411 Myrtle Ave
- 1405 Myrtle Ave Unit 11
- 1159 S 2nd St Unit 61
- 1167-73 S 2nd St
- 1167 S 2nd St Unit 73
- 1153 S 2nd St Unit 57
- 1175 S 2nd St Unit 77
- 1173 S 2nd St
- 1151 S 2nd St
- 1179 S 2nd St Unit 85
- 1147 S 2nd St
- 1158 W 3rd St Unit 60
- 1154 W 3rd St Unit 56
- 1204 W 3rd St Unit 6
- 1148 W 3rd St Unit 52
- 1208 W 3rd St Unit 10
- 1148-52 W 3rd St
- 1145 S 2nd St Unit 1
- 1145 S 2nd St
- 1187 S 2nd St Unit 89
- 1212 W 3rd St Unit 14
- 1200 W 3rd St Unit 2