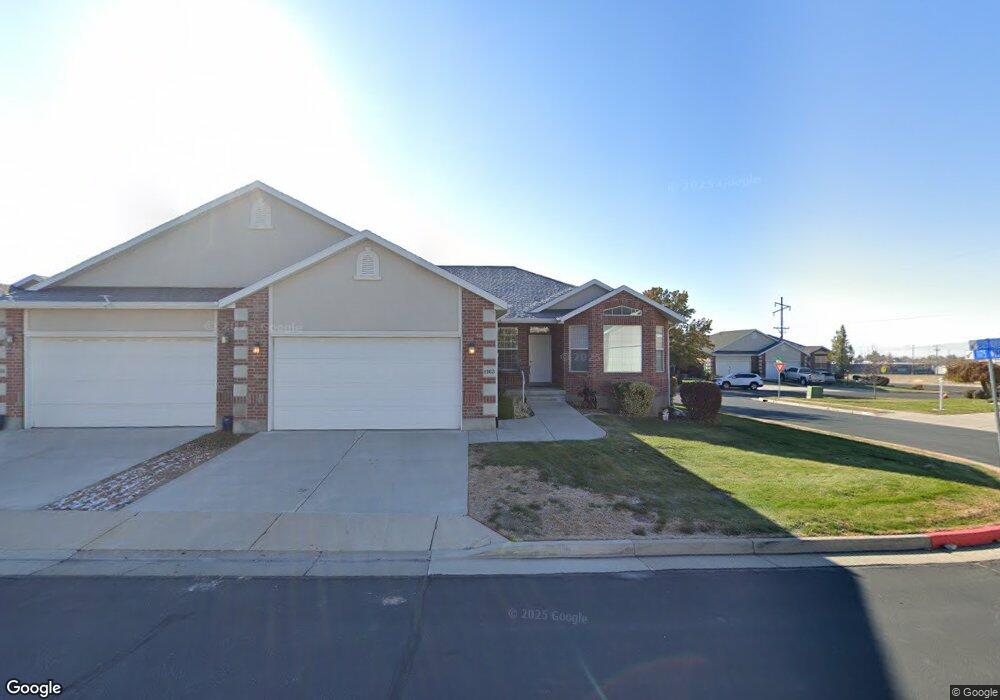
1163 W 2325 N Layton, UT 84041
Estimated Value: $432,000 - $517,000
4
Beds
3
Baths
3,346
Sq Ft
$140/Sq Ft
Est. Value
About This Home
This home is located at 1163 W 2325 N, Layton, UT 84041 and is currently estimated at $468,971, approximately $140 per square foot. 1163 W 2325 N is a home located in Davis County with nearby schools including Lincoln Elementary School, North Layton Junior High School, and Northridge High School.
Ownership History
Date
Name
Owned For
Owner Type
Purchase Details
Closed on
May 7, 2014
Sold by
Cragun Loa Jeanne
Bought by
Cragun Loa Jeanne and The Loa Jeanne Cragun Family Trust
Current Estimated Value
Purchase Details
Closed on
Jul 22, 2004
Sold by
Cragun Loa Jeanne and Cragun Lewis Budge
Bought by
Cragun Loa Jeanne
Purchase Details
Closed on
Mar 18, 2004
Sold by
Child Clark Blaine and Child Beverly Jean
Bought by
Cragun Loa Jeanne and Cragun Lewis Budge
Home Financials for this Owner
Home Financials are based on the most recent Mortgage that was taken out on this home.
Original Mortgage
$135,900
Interest Rate
5.69%
Mortgage Type
Balloon
Purchase Details
Closed on
Jan 22, 2003
Sold by
Child Clark Blaine and Child Beverly Jean
Bought by
Child Clark Blaine and Child Beverly Jean
Home Financials for this Owner
Home Financials are based on the most recent Mortgage that was taken out on this home.
Original Mortgage
$101,900
Interest Rate
5.39%
Mortgage Type
Purchase Money Mortgage
Create a Home Valuation Report for This Property
The Home Valuation Report is an in-depth analysis detailing your home's value as well as a comparison with similar homes in the area
Home Values in the Area
Average Home Value in this Area
Purchase History
| Date | Buyer | Sale Price | Title Company |
|---|---|---|---|
| Cragun Loa Jeanne | -- | None Available | |
| Cragun Loa Jeanne | -- | -- | |
| Cragun Loa Jeanne | -- | Heritage West Title Ins | |
| Child Clark Blaine | -- | Heritage West Title Insuranc | |
| Child Clark Blaine | -- | Bonneville Title Company Inc |
Source: Public Records
Mortgage History
| Date | Status | Borrower | Loan Amount |
|---|---|---|---|
| Closed | Cragun Loa Jeanne | $135,900 | |
| Previous Owner | Child Clark Blaine | $101,900 |
Source: Public Records
Tax History Compared to Growth
Tax History
| Year | Tax Paid | Tax Assessment Tax Assessment Total Assessment is a certain percentage of the fair market value that is determined by local assessors to be the total taxable value of land and additions on the property. | Land | Improvement |
|---|---|---|---|---|
| 2025 | $341 | $237,050 | $68,200 | $168,850 |
| 2024 | $407 | $231,000 | $52,250 | $178,750 |
| 2023 | $383 | $425,000 | $91,000 | $334,000 |
| 2022 | $425 | $237,600 | $45,650 | $191,950 |
| 2021 | $473 | $340,000 | $69,000 | $271,000 |
| 2020 | $430 | $303,000 | $51,000 | $252,000 |
| 2019 | $2,059 | $292,000 | $49,000 | $243,000 |
| 2018 | $1,819 | $259,000 | $49,000 | $210,000 |
| 2016 | $1,660 | $121,935 | $26,950 | $94,985 |
| 2015 | $1,550 | $108,075 | $26,950 | $81,125 |
| 2014 | $1,622 | $115,632 | $18,333 | $97,299 |
| 2013 | -- | $101,793 | $42,911 | $58,882 |
Source: Public Records
Map
Nearby Homes
- 1155 W 2325 N
- 1139 W 2325 N
- 2309 N 1175 W
- 2315 N 1175 W
- 1162 W 2325 N
- 1162 W 2325 N Unit 11
- 1170 W 2325 N
- 1176 W 2325 N
- 1154 W 2325 N
- 1125 W 2325 N Unit 26
- 1125 W 2325 N
- 1159 W 2300 N
- 1167 W 2300 N
- 1167 Spring Creek Dr
- 1134 W 2325 N Unit 36
- 1134 W 2325 N Unit 35
- 1134 W 2325 N
- 1175 W 2300 N
- 2209 Spring Creek Dr
- 1121 W 2325 N